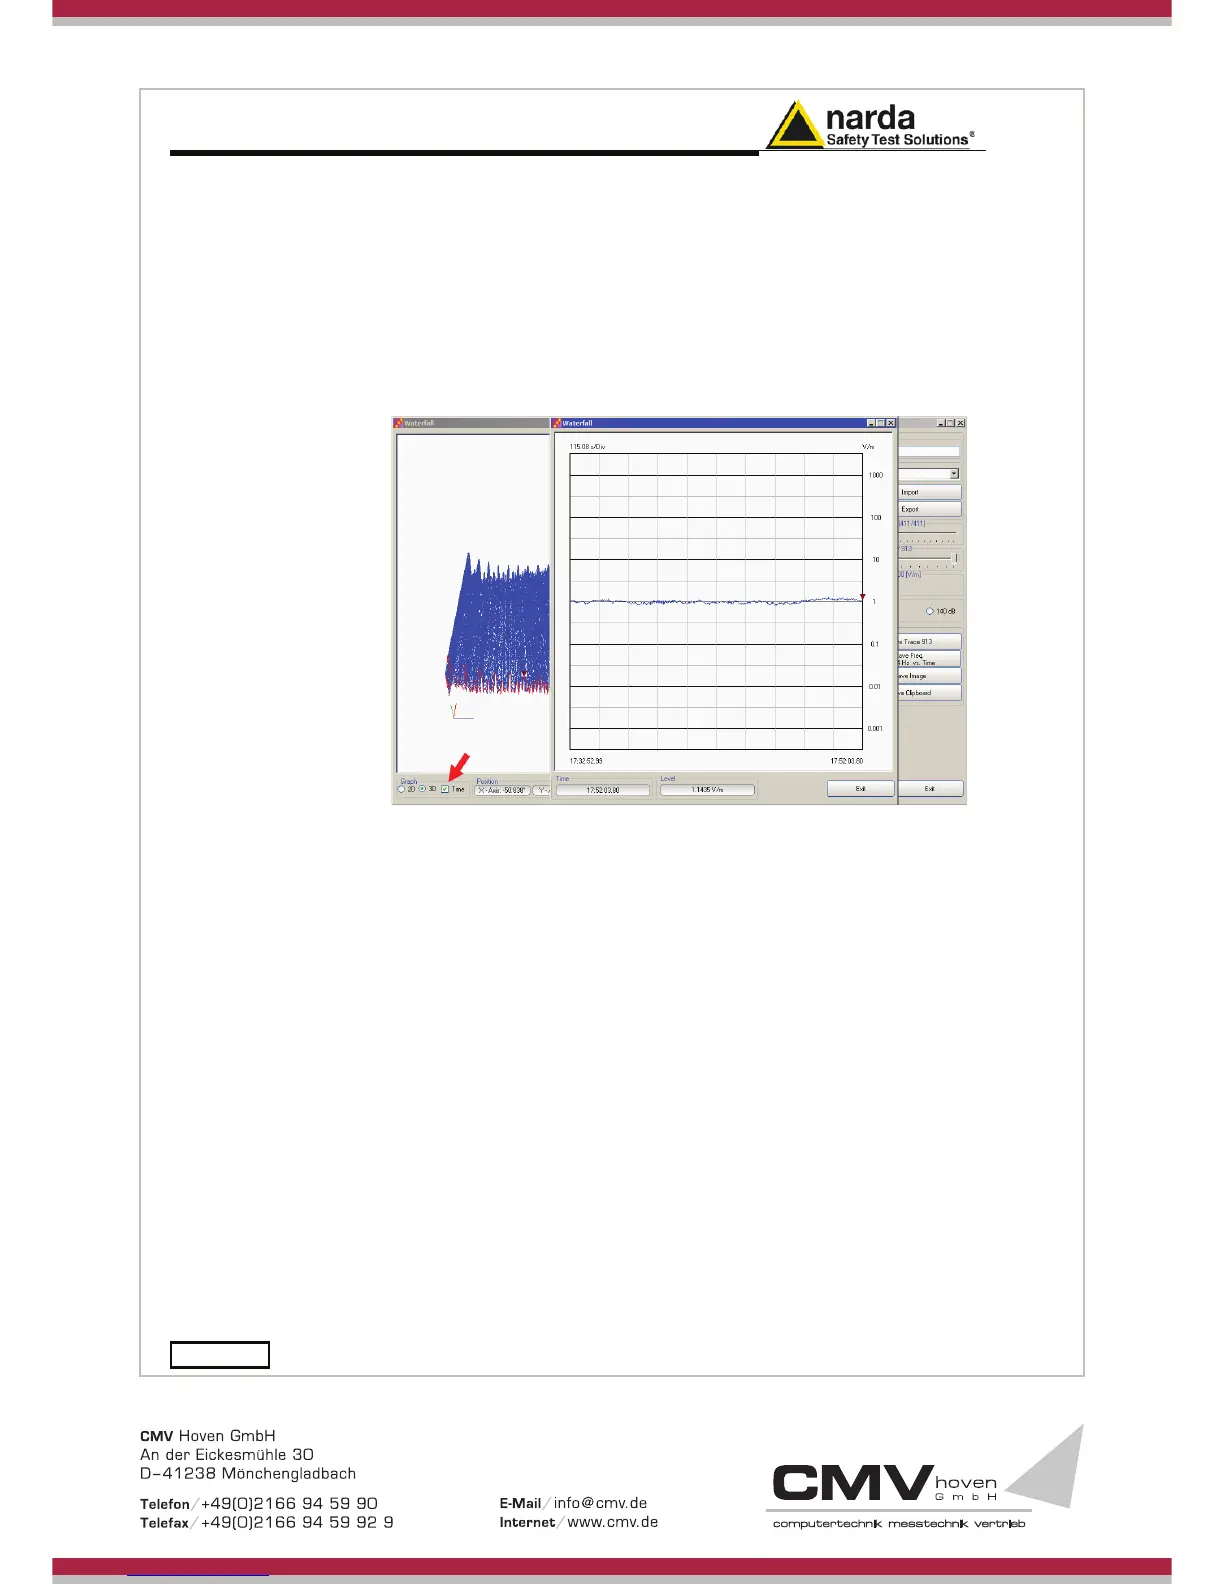
nother option of the Graph 3D, the Time plot, is available when the Marker
is active.
Tick the Time label to enter this view.
new window pops up and the plot represents the level at the marker
frequency versus time.
The horizontal axis of the grid is the time and the vertical axis is the field
level.
The Marker can be moved with the mouse to look for the desired
frequency.
In the 3D view also the dynamic can be selected between 120 and 140 dB,
to help for the best identification of disturbances.