Nuvoton Nu-Link Debug Adapter User Manual
Oct 28, 2014 - 9 - Revision V1.01
3.1 Debugging
This section briefly describes the debugging function supported by the Nu-Link Adapter. For more
details, please refer to the related user manuals.
3.1.1 Debug Mode
The Nu-Link Adapter supports debugging for the NuMicro™ Family chips based on the SWD signal
interface. The third-party tools that support using the Nu-Link Adapter for chip debugging include Keil
RVMDK, IAR EWARM, and CooCox CoIDE. Some more functions supported in Debug mode are
described as follows.
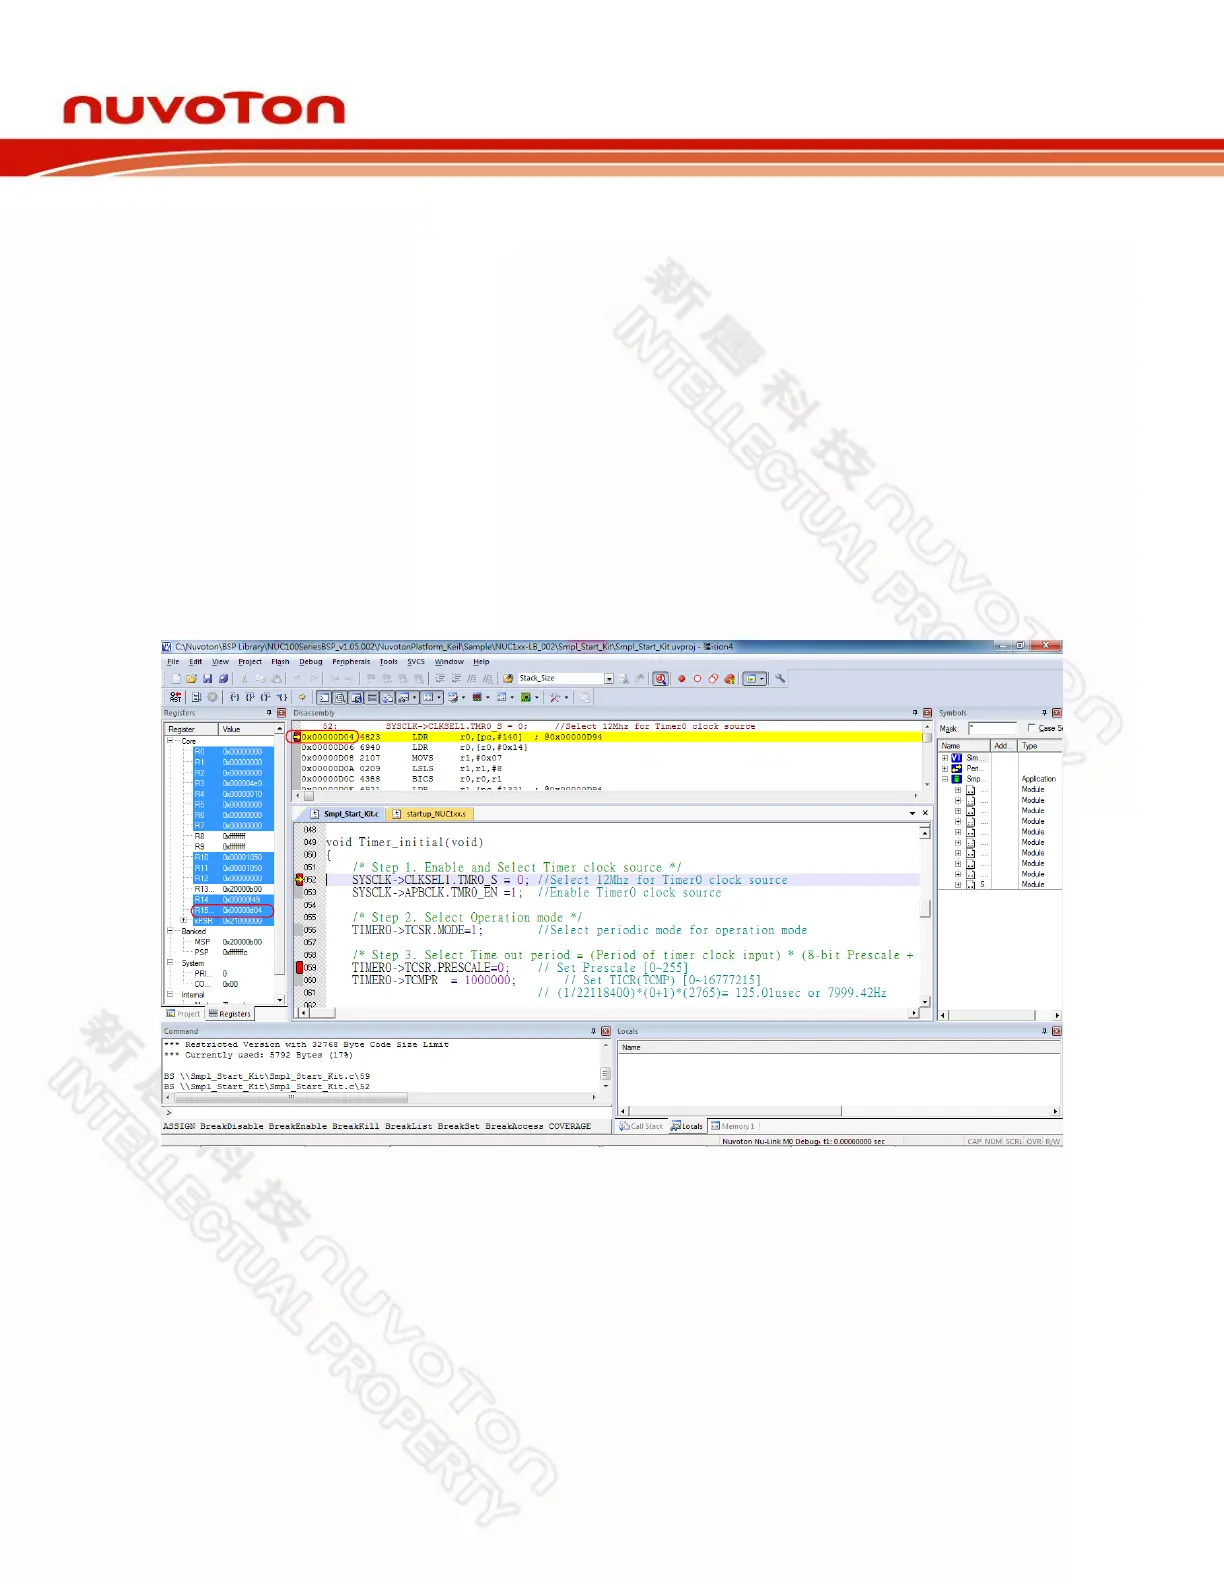
3.1.2 Breakpoints
In Debug mode, the user can add breakpoints in the code for debugging. During the real-time
simulation of the Nu-Link Adapter, the chip simulation will be stopped at a specific breakpoint. Figure
3-1 shows the breakpoint settings in Keil RVMDK Debug mode. The red labels on lines 052 and 059
indicate the breakpoints inserted; the yellow arrow refers to the code to be executed next and shows
the register value of Program Counter (PC) (i.e. “R15(PC)=0x00000D04” in the Registers pane in
Figure 3-1).
Figure 3-1 Setting Breakpoints in Keil RVMDK Debug Mode
3.1.3 Direct Register Control Interface
The Direct Register Control Interface can be used to display the register content in a target chip and
manipulate the registers. Take Keil RVMDK Debug mode for example, invoke the Debug command
and select a register from the “function register list” (e.g. ADC, CAN, CLK, etc.) to open the Direct
Register Control Interface of the selected register, as shown in Figure 3-2.