9 C-Quant Program
26 / 56 Instruction Manual C-Quant ( G/80000/1007/en)
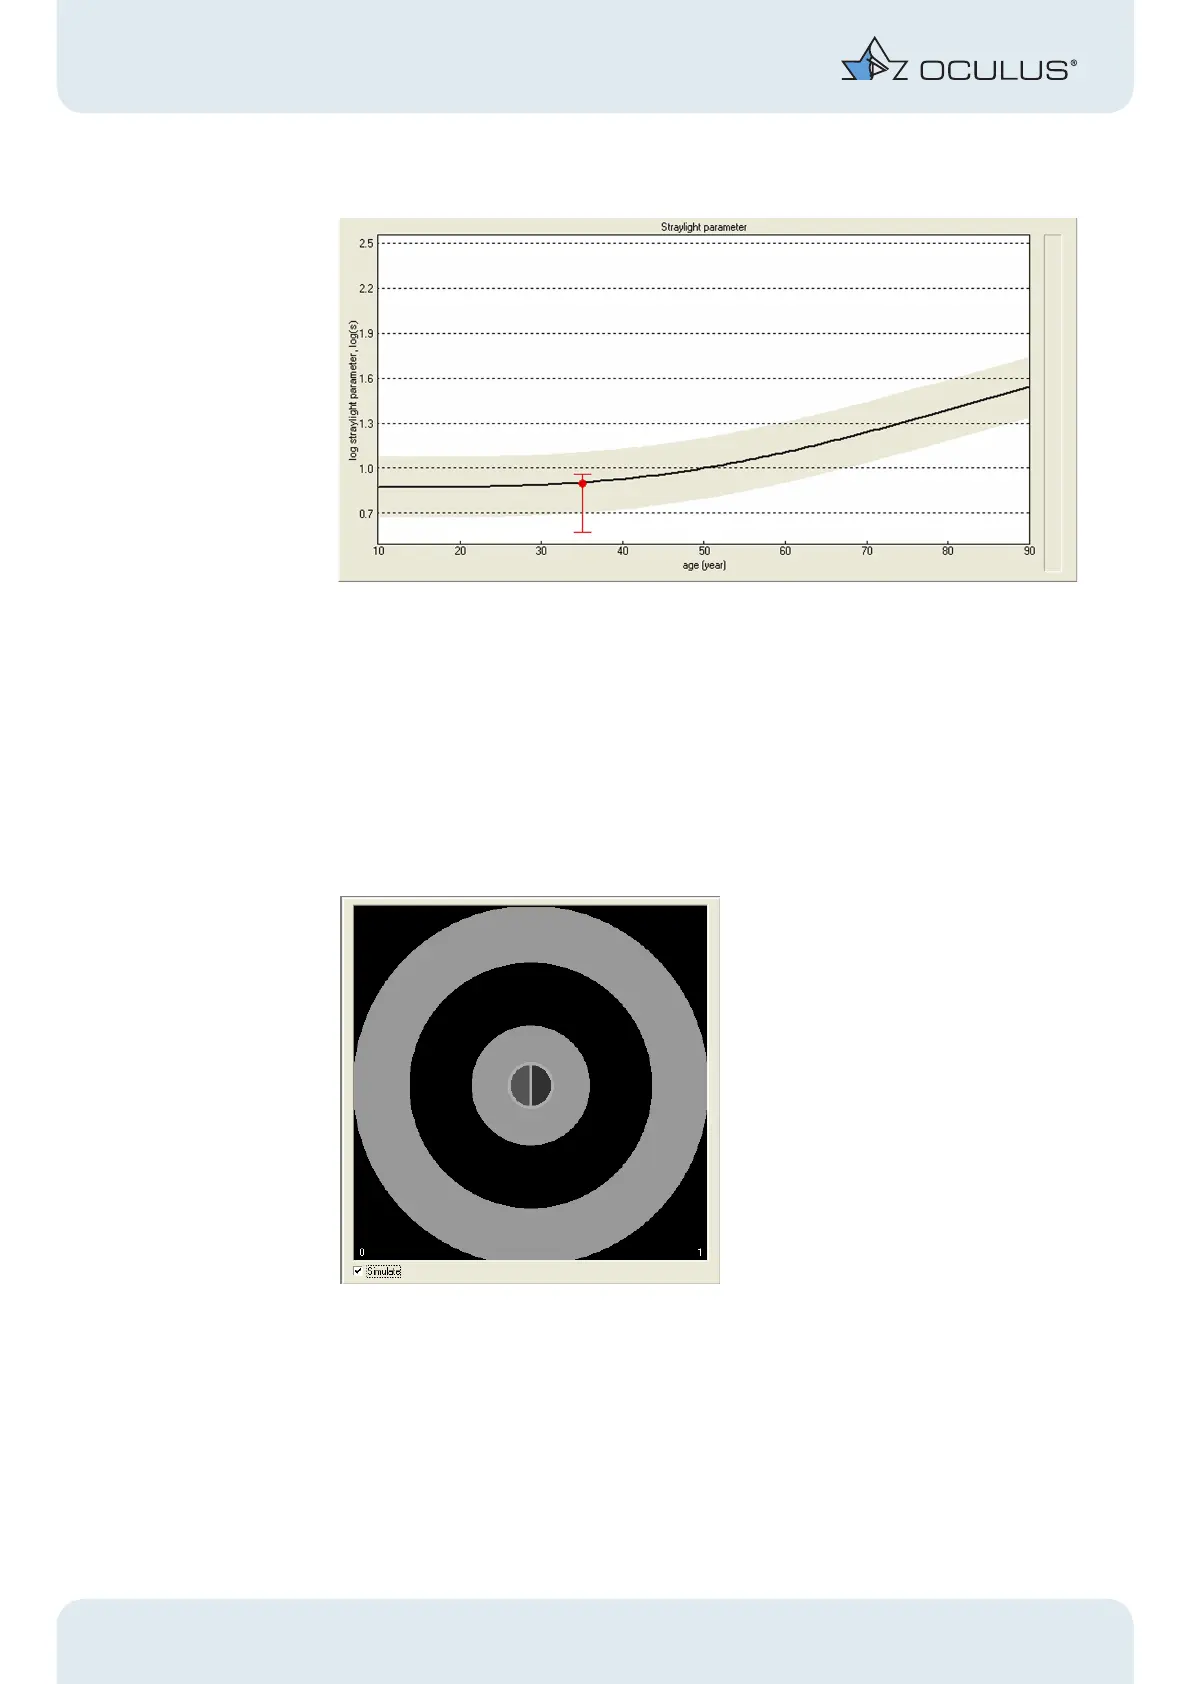
Graphic (straylight parameter)
Fig. 9-7: Graphic: measured straylight value
The measured straylight value (log(s)) is entered in the normal age curve (red dot).
The black line is the average curve, while the gray area gives the range of normal
variation.
If the red dot is outside the gray area, this signifies a conspicuous finding.
9.1.4 Examination fields
Stimulus field view
Fig. 9-8: Stimulus field
This is the diagram presented to the patient.
The "0" and "1" at the bottom indicate with which key the patient can produce the re-
sponses "0" or "1" in the examination response chart.
If you want to first explain the examination procedure to the patient, activate
"Simulate".