10 How the C-Quant works
Instruction Manual C-Quant ( G/80000/1007/en) 31 / 56
2 The right test field shows compensation light at intensity level 5. This means that the
left test field has a flicker intensity of 10, while the right field has a flicker intensity
of 10 -5 = 5. The response will most often be "0". If the stimulus is repeated suffi-
ciently often he will sometimes give "1". Ultimately the outcome will tend towards
0.1.
3 This stimulus is referred to as direct compensation. The straylight is of equal inten-
sity as the compensation light, so that the patient will not see any flicker in the right
test field and will therefore answer with "0".
4 Here the difference in flicker intensity between the right and left test field is 5 again.
As with stimulus 2 the flicker intensity of the left test field is greater. The average
response value will be 0.1.
5 The compensation light is precisely twice as intense as the scattered light, meaning
that the flicker intensity is 20-10=10, equal to that in the other test field. The patient
will therefore find that the two test fields flicker with equal intensity and the out-
come will tend towards 0.5.
6 Here the compensation light is 2.5 times as intense as the scattered light, and the
patient will give an average response of 0.85.
7 The compensation light is 3 times as intense as the scattered light and clearly pro-
duces greater flicker. The patient will give 1 on average.
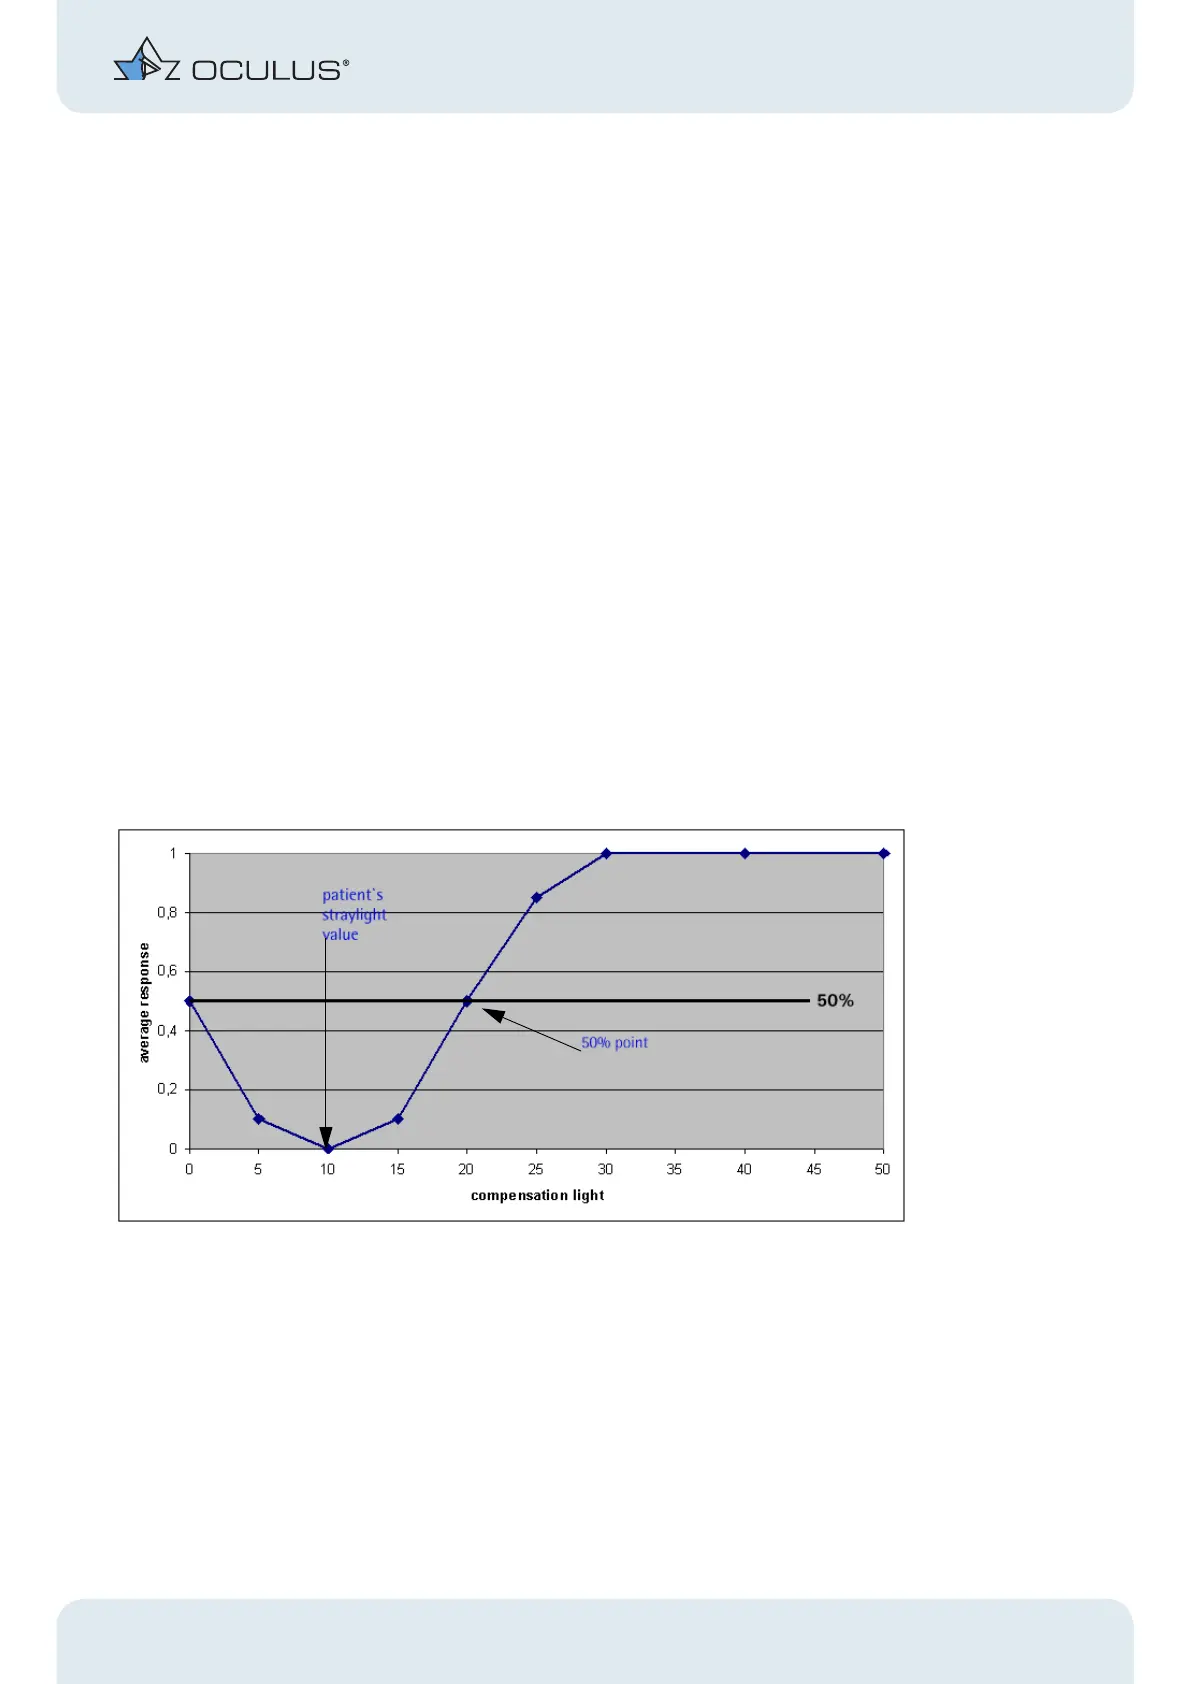
Plotting the results in a chart gives the following picture (two measurement points have
been added to extend the curve):
Fig. 10-3: Plotting the results in a chart
10.3 The psychometric function
The curve in Fig. 10-3 represents a rough approximation of what is known as the "psy-
chometric function".
This concept is widely applicable to human sensory functions and is used to describe phe-
nomena of hearing, smelling, pain perception and vision.
In our case the curve will shift over the abscissa (x-axis) to a greater or lesser degree, de-
pending on the patient’s straylight value.