Displaying results
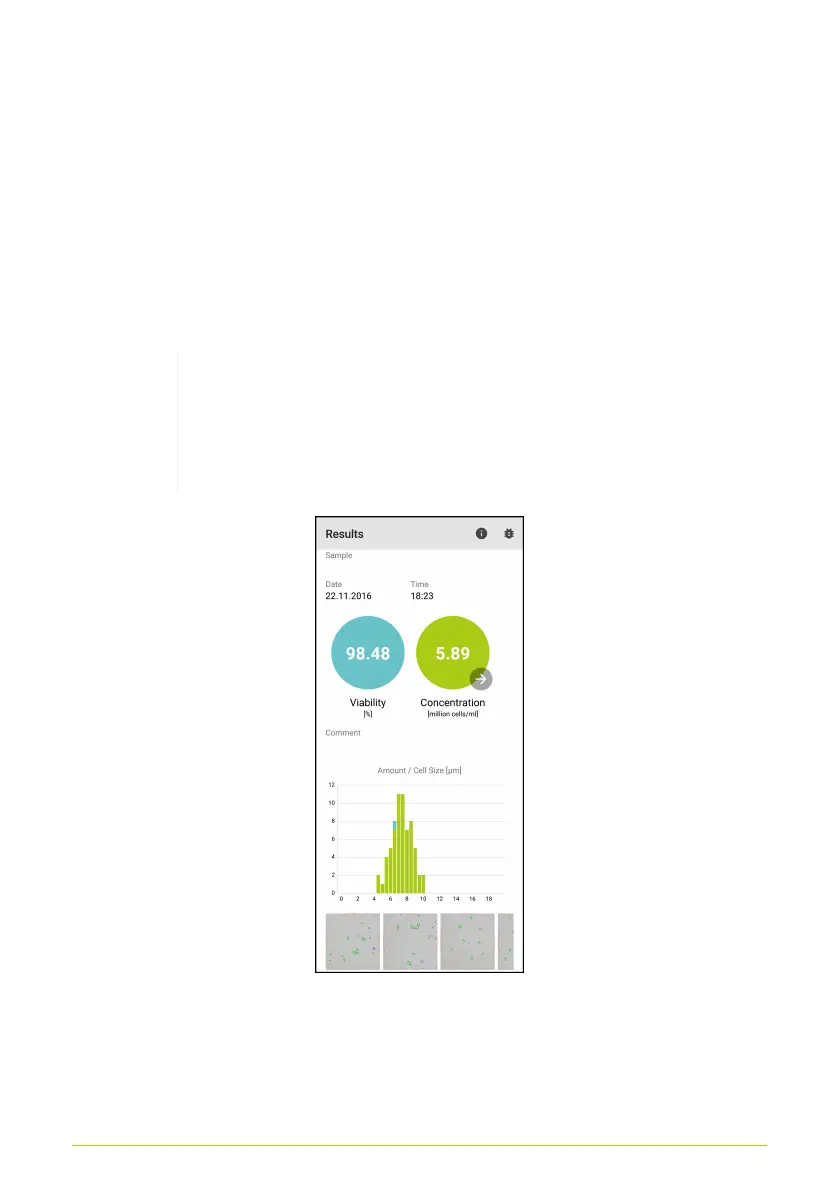
After cloud analysis has completed, a results screen is loaded
(Fig. 20). The calculated concentration appears in cells/ml (green
circle) and (if selected) the viability is displayed as a percentage
(blue circle). You can access the Pitch Rate Calculator via the
click of the arrow, which appears in the result circle for the
concentration.
The concentration displayed refers to the undiluted
sample. The information on dilution and mixing
provided by the user are factored in during
calculation.
Figure 20. Display of results
The histogram shows a distribution of the cell sizes in the
sample. The green bars indicate live cells, and the blue bars
21