EasyManuals Logo

Omron NA Series Practices Guide

Omron NA Series
69 pages
To Next Page IconTo Next Page
To Previous Page IconTo Previous Page
Page #36 background imageLoading...
Page #36 background image
36
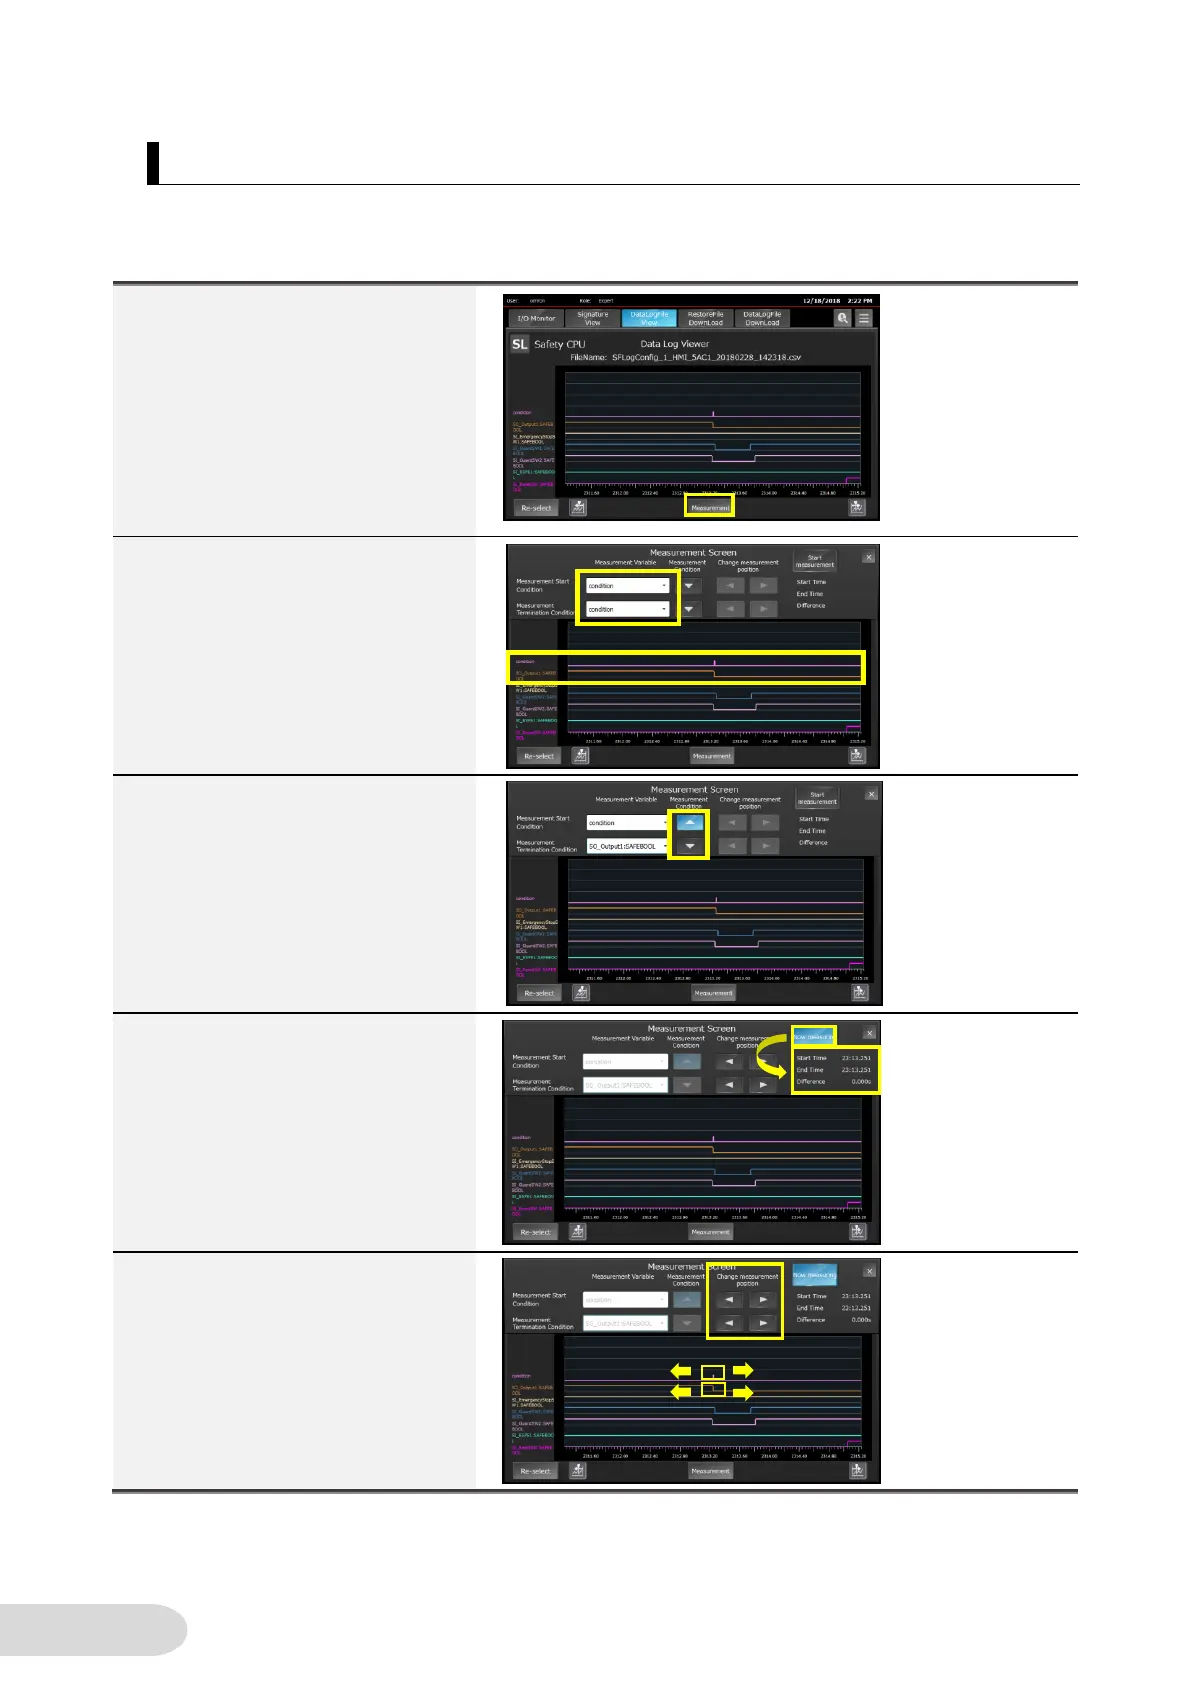
5-3-3 Measurement of Time Length between Two Points on a Graph
Display the difference between the rise and fall times of any of the variables in the data logging
results displayed in trend graphs.
1. Press [Measurement] at the
bottom of the timing chart
screen.
2. The Measurement Screen is
displayed.
Select two variables as a
measurement start condition
and a measurement termination
condition.
3. Set the measuring conditions for
the selected variable, Rising or
Falling.
4. Press the [Start Measurement]
button to display the difference
of time between the two
conditions.
5. Press the [] or [] button to
change the object to measure.
You can find the next (or
previous) data that satisfies the
measurement conditions.

Other manuals for Omron NA Series

Questions and Answers:

Question and Answer IconNeed help?

Do you have a question about the Omron NA Series and is the answer not in the manual?

Omron NA Series Specifications

General IconGeneral
Touch PanelResistive
InterfacesUSB, Ethernet, RS-232/422/485
Operating Temperature0°C to 50°C
Power Supply24 VDC
Protection RatingIP65 (front panel)
Storage Temperature-20°C to 60°C
Display TypeTFT LCD
DimensionsVaries depending on the model
WeightVaries depending on the model

Related product manuals