96
6
Summary, Results Log and Trend 90
1. From the Main Menu, press
or to highlight Summary and
press
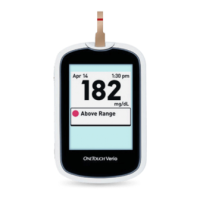
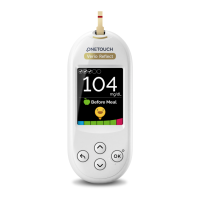
The number of results that are
low (blue), in-range (green) and
high (red) are displayed and
appear as bar graphs.
Summary
Results Log
Trend 90
Settings
May 29:31 am
Example
70
Summary
15
23
Last 30 days
 Loading...