PEC017
5/3/2018 Page 72 of 105
Additional Information
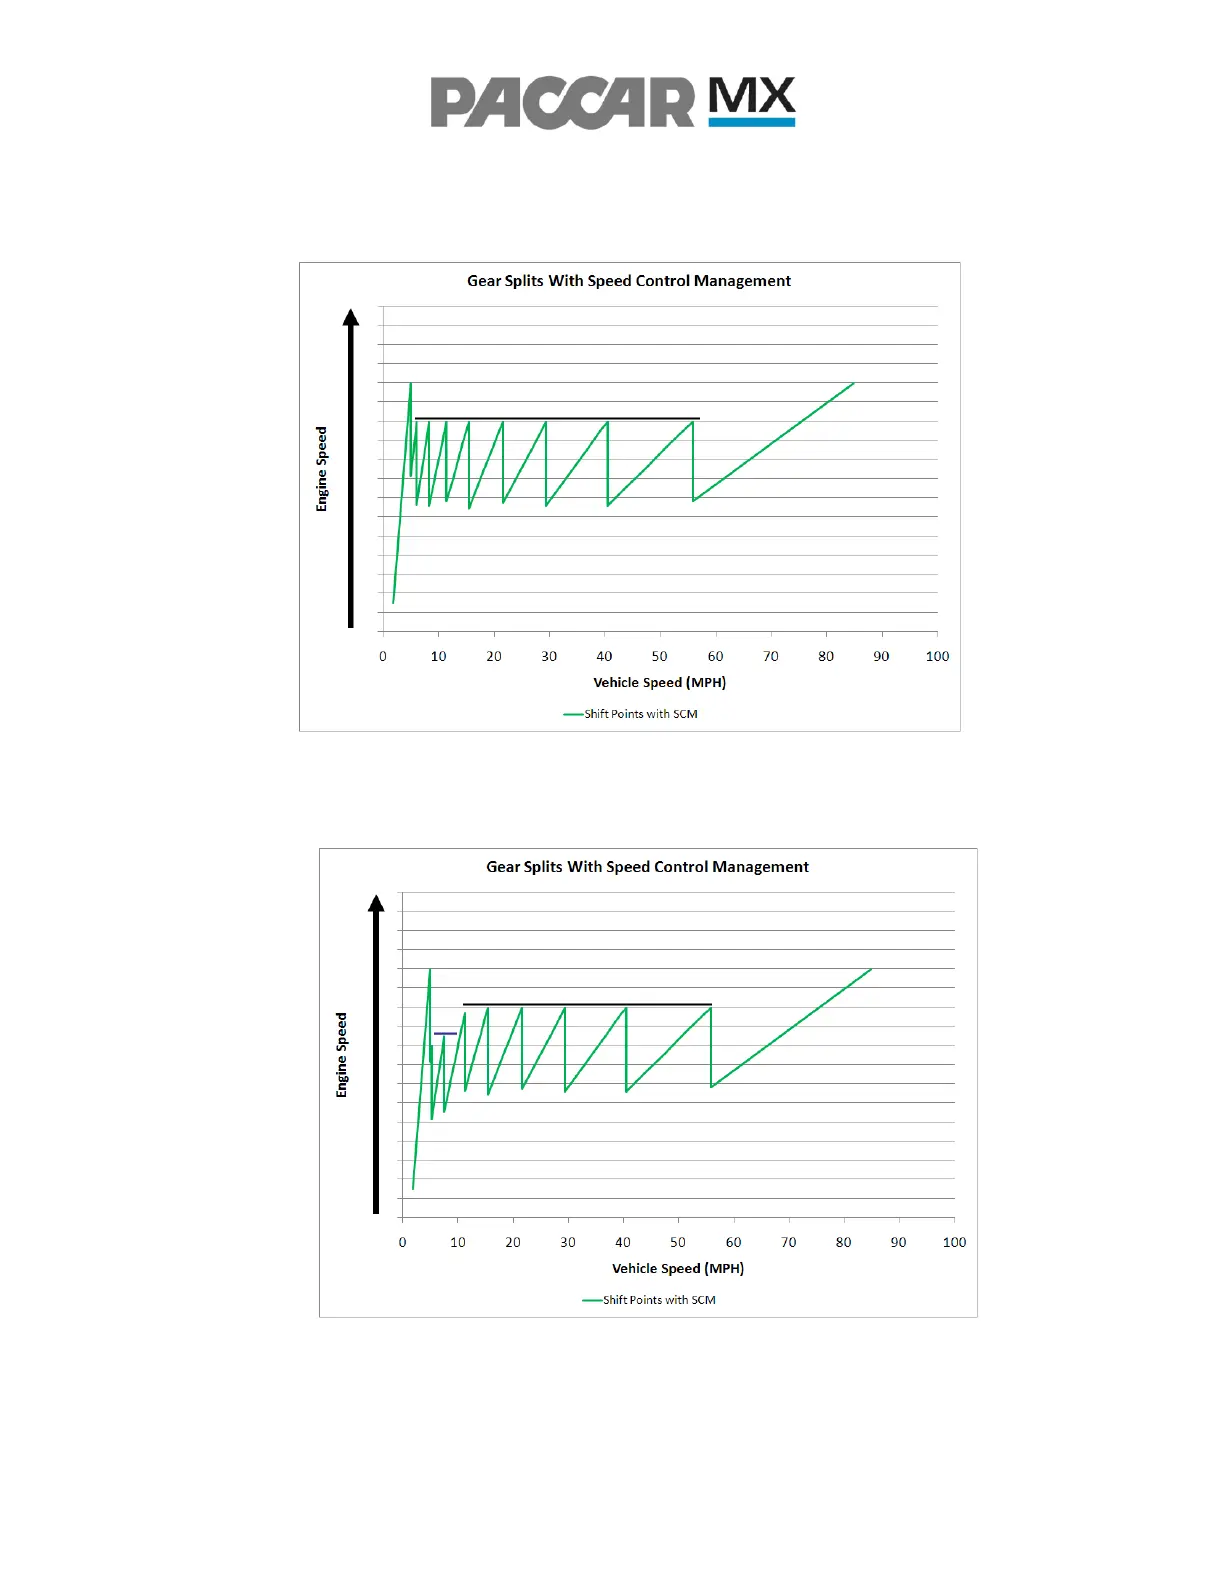
Progressive Shift Threshold Graphs
The black line in Graph 15.1 illustrates the Progressive Shift limit if applicable.
Graph 15.1 - One Engine Speed Control Limit
The blue line in Graph 15.2 illustrates the 1st Progressive Shift limit if applicable. The
black line illustrates the 2nd Progressive Shift limit if applicable.
Graph 15.2 – Two Engine Speed Control Limits