System 450™ Series Modular Control Systems with Standard Control Modules Technical Bulletin
53
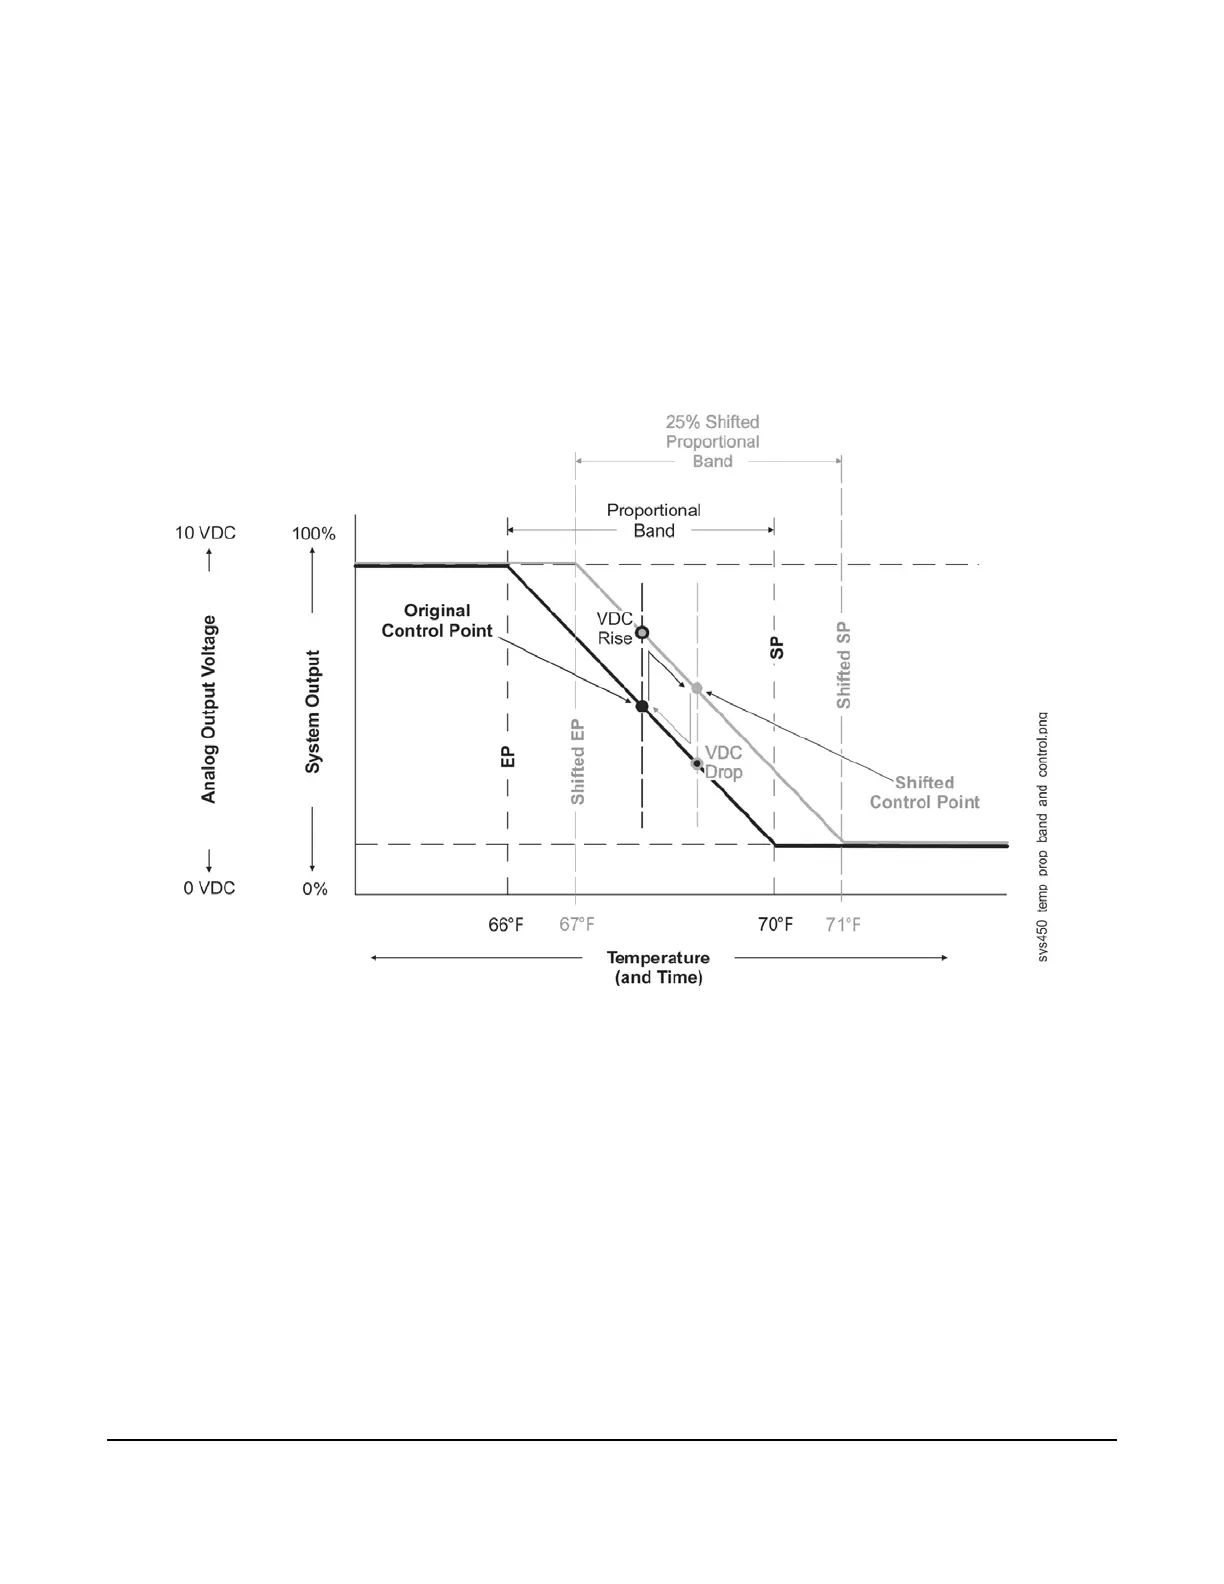
2. Connect a digital volt-meter across the analog output terminals to measure VDC signal strength changes.
Measure and record the signal strength voltage at this (original) stable control point.
3. Change the Setpoint and End Point values to shift (step change) the proportional band 25% away from the
original proportional band; the VDC signal rises (or drops) immediately and significantly in response to the
proportional band shift. Begin timing the response (to the first step change) at this voltage rise (or drop).
The direction of the voltage changes (rise or drop) depends on whether the analog output is set up as a
direct-acting or reverse-acting output signal. These instructions refer to the room heating application example
shown in Figure 31.
4. Observe the system response and record the time it takes for the measured voltage to drive to and stabilize at
the shifted control point in the shifted proportional band. (Typically, the shifted control point voltage is slightly
higher [or lower] than the original control point voltage.)
5. With the controlled system stabilized at the shifted control point, return (second step change) the Setpoint and
End Point values back to the original proportional band. The signal VDC drops (or rises) immediately and
significantly in response to the proportional band shift back to original. Begin timing the response (to the
second step change) at this voltage drop (or rise).
6. Observe the system response and record the time it takes for the measured voltage to drive back to and
stabilize at original control point (voltage) in the original proportional band.
Note: In many applications, the response time away from the original control point to the shifted control point
is different from the response time of the shifted control point back to the original control point,
depending on a variety of factors such as system load and system output. Choose the slower of the
two measured response times to determine the I-C setting for your application.
Figure 31: Graph Showing Temporary Proportional Band and Control Point Shifts
Used to Measure Response Time in a Heating Application
 Loading...