Operating Instructions
Page 14
RevA
6.3. T1/T2 Pressure Display
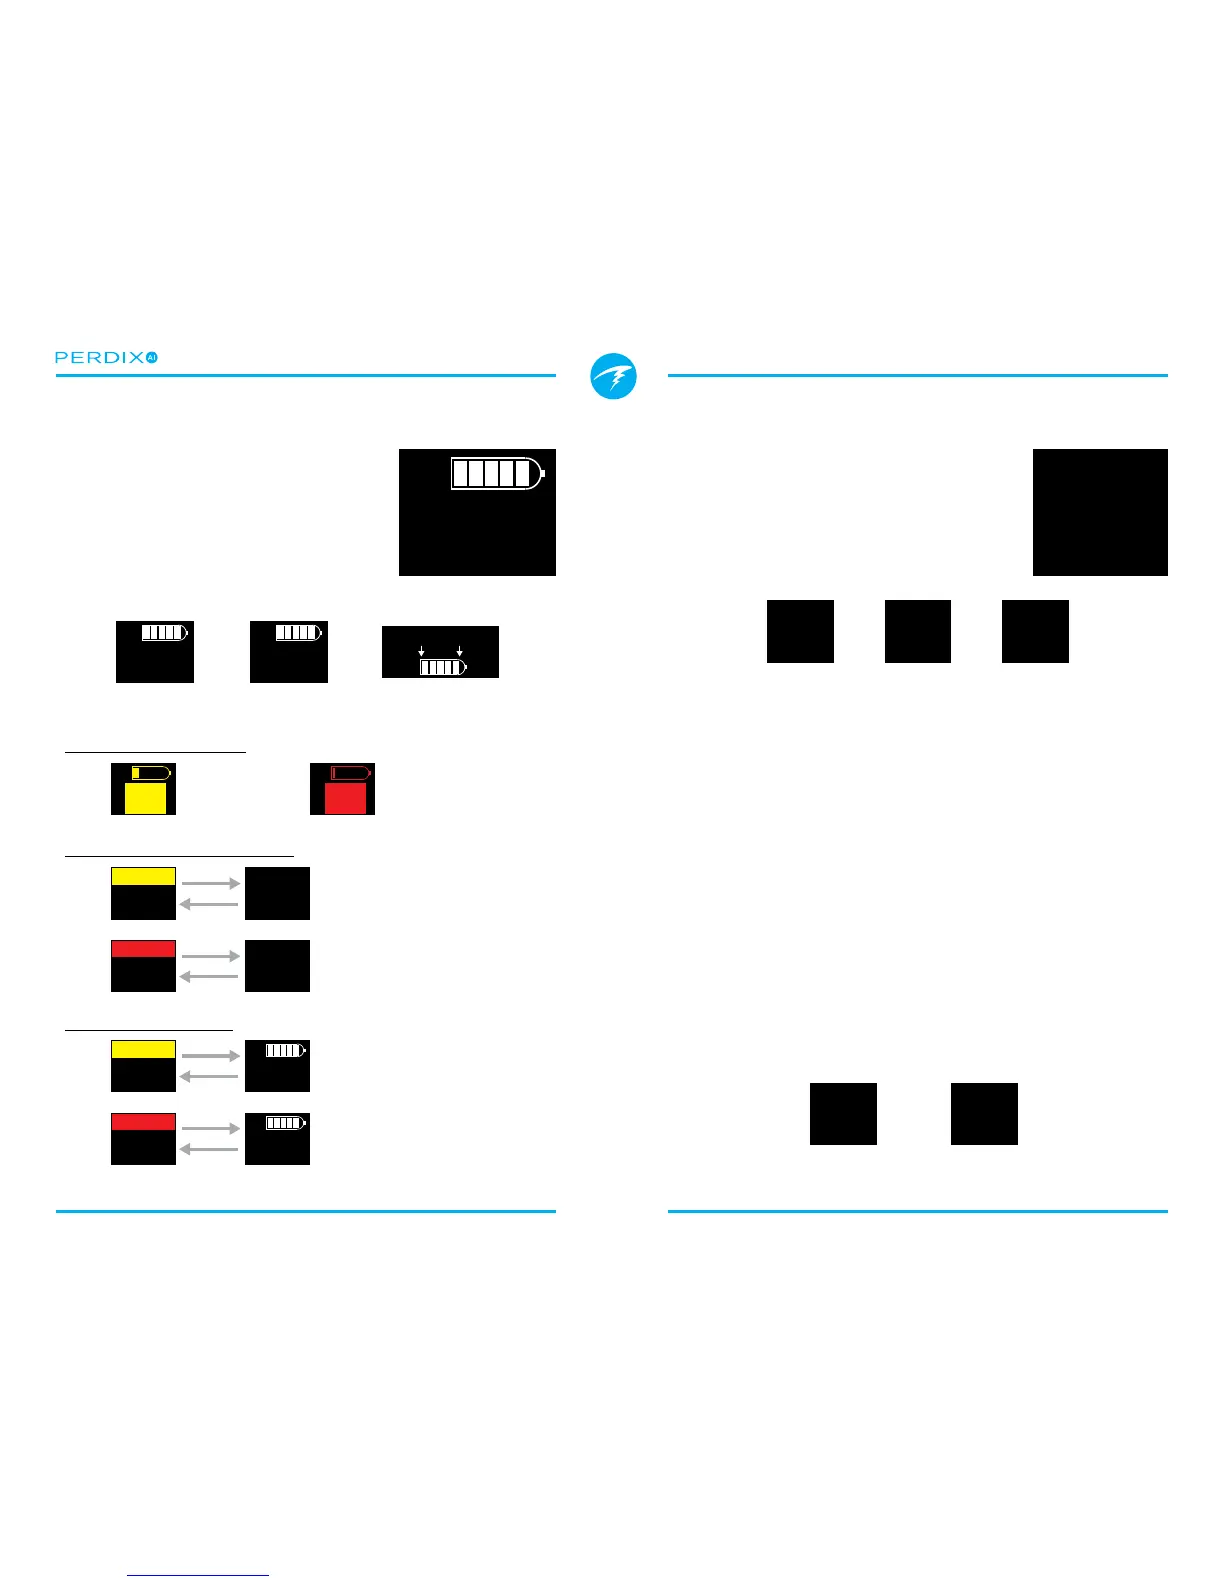
The pressure displays (FIGURE 20) are the
most fundamental AI displays, showing
pressure in the current units (PSI or Bar)�
Additionally, a bar graph represents the
pressure graphically� This bar graph is
scaled from zero pressure up to the rated
pressure setting� This is NOT a battery
level indicator�
Reserve
Pressure
Critical
Pressure
No GTR
on surface
At start of dive,
wait for data to
stabilize
No communications for
30 to 90 seconds
No communications for
greater than 90 seconds
Battery should be
replaced soon
Battery should be
replaced immediately
Low Pressure Warnings:
No Communications Warnings:
Low Battery Warnings:
I
P
S
Low Bat
Alternates
682
6.4. GTR Display
The Gas Time Remaining display (FIGURE
22) shows the time, in minutes, that you
could stay at the current depth until a direct
ascent to the surface at a speed of 33 feet/
min (10 m/min) would result in surfacing
with the reserve gas pressure remaining�
The value is displayed in yellow when less than or equal to 5
minutes� The value is displayed in red when less than or equal
to 2 minutes�
GTR can only be based on a single tank� The title indicates
which transmitter (T1 or T2) is being used for the GTR and
SAC calculations in a dark gray font� When on the surface, the
GTR displays “---”� GTR is not shown when decompression
stops are needed, and will display “deco”.
SAC data from the rst 30 seconds of each dive is discarded.
It then takes an additional few minutes to calculate the
average SAC. Therefore, for the rst few minutes of each
dive, the GTR will display “wait”, until enough data has been
collected to begin making GTR predictions (FIGURE 23)�
More information on how GTR and SAC are calculated can be
found in Section 7. How SAC and GTR are calculated�


 To Next Page