58
Precision
Tests were carried by trained technicians in the
laboratory setting. The venous whole blood from
one subject was adjusted to 6 different levels.
Strips out of a single lot were tested. The results
are shown in the following table.
ACH
Level
No. of
test
Mean (mg/dL) Within-Run C.V. (%)
I
II
III
IV
V
VI
100
100
100
100
100
100
41.6
100.1
124.8
215.8
340.0
537.4
4.6
4.1
2.5
3.6
3.5
2.6
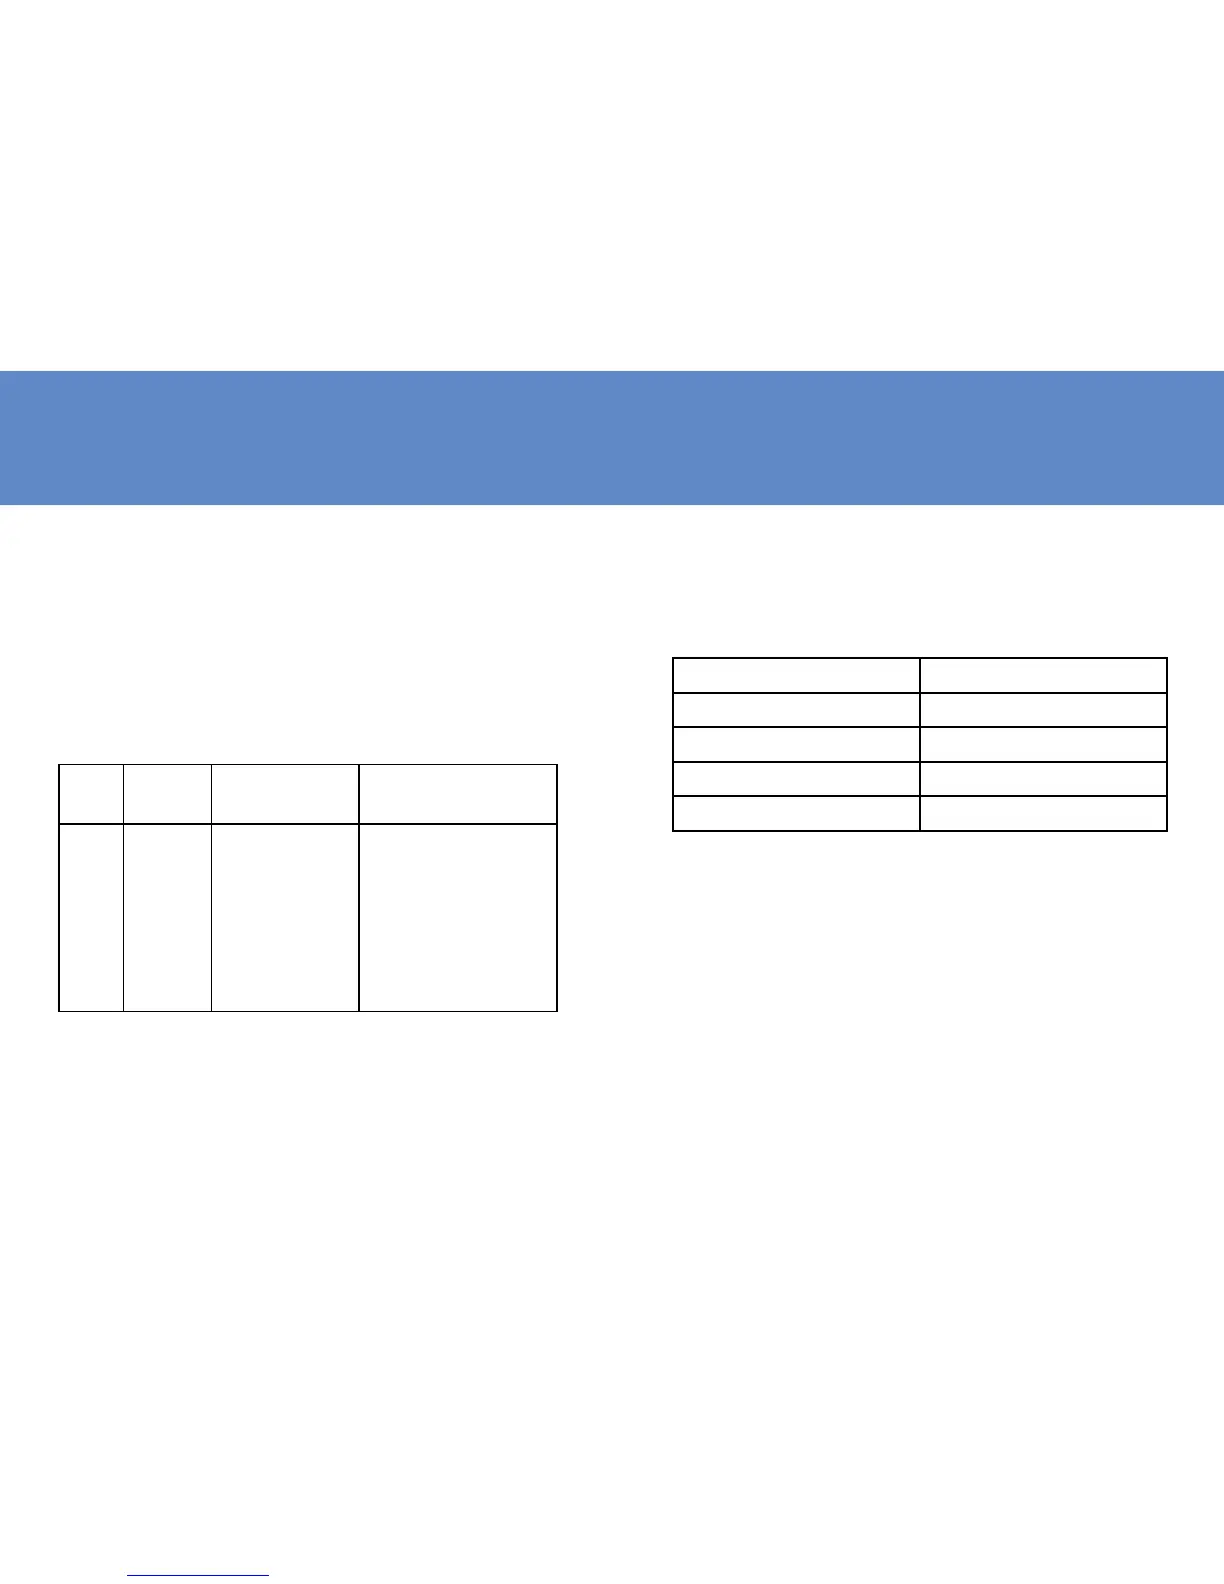
Accuracy
Tests were performed at hospital by healthcare
professionals and diabetic patients. Fresh capil-
lary nger whole blood samples were tested with
Performance Evaluations
59
the PRECICHEK System; plasma samples from the
subjects were tested with YSI Model 2300 Glucose
Analyzer as reference. The results are shown in
the following table.
Slope 0.94
Y-Intercept 13.9 mg/dL
Correlation Coefcient 0.99
Number of test 118
Range Tested 25-580 mg/dL
Reference
1. American Diabetes Association Position Statement,
Diabetes Care Vol. 34 (Suppl.1), p. S13 (2011)
2. American Diabetes Association Position Statement,
Diabetes Care Vol. 34 (Suppl.1), p.S21 (2011).
NOTE: THE PRODUCT IS TESTIFIED BY A THIRD PARTY THAT IT
DOESN’T INTERFACE WITH OTHER POSSIBLE ELECTROMAG-
NETIC WAVE.