© PSI (Photon Systems Instruments), spol. s r. o.
47
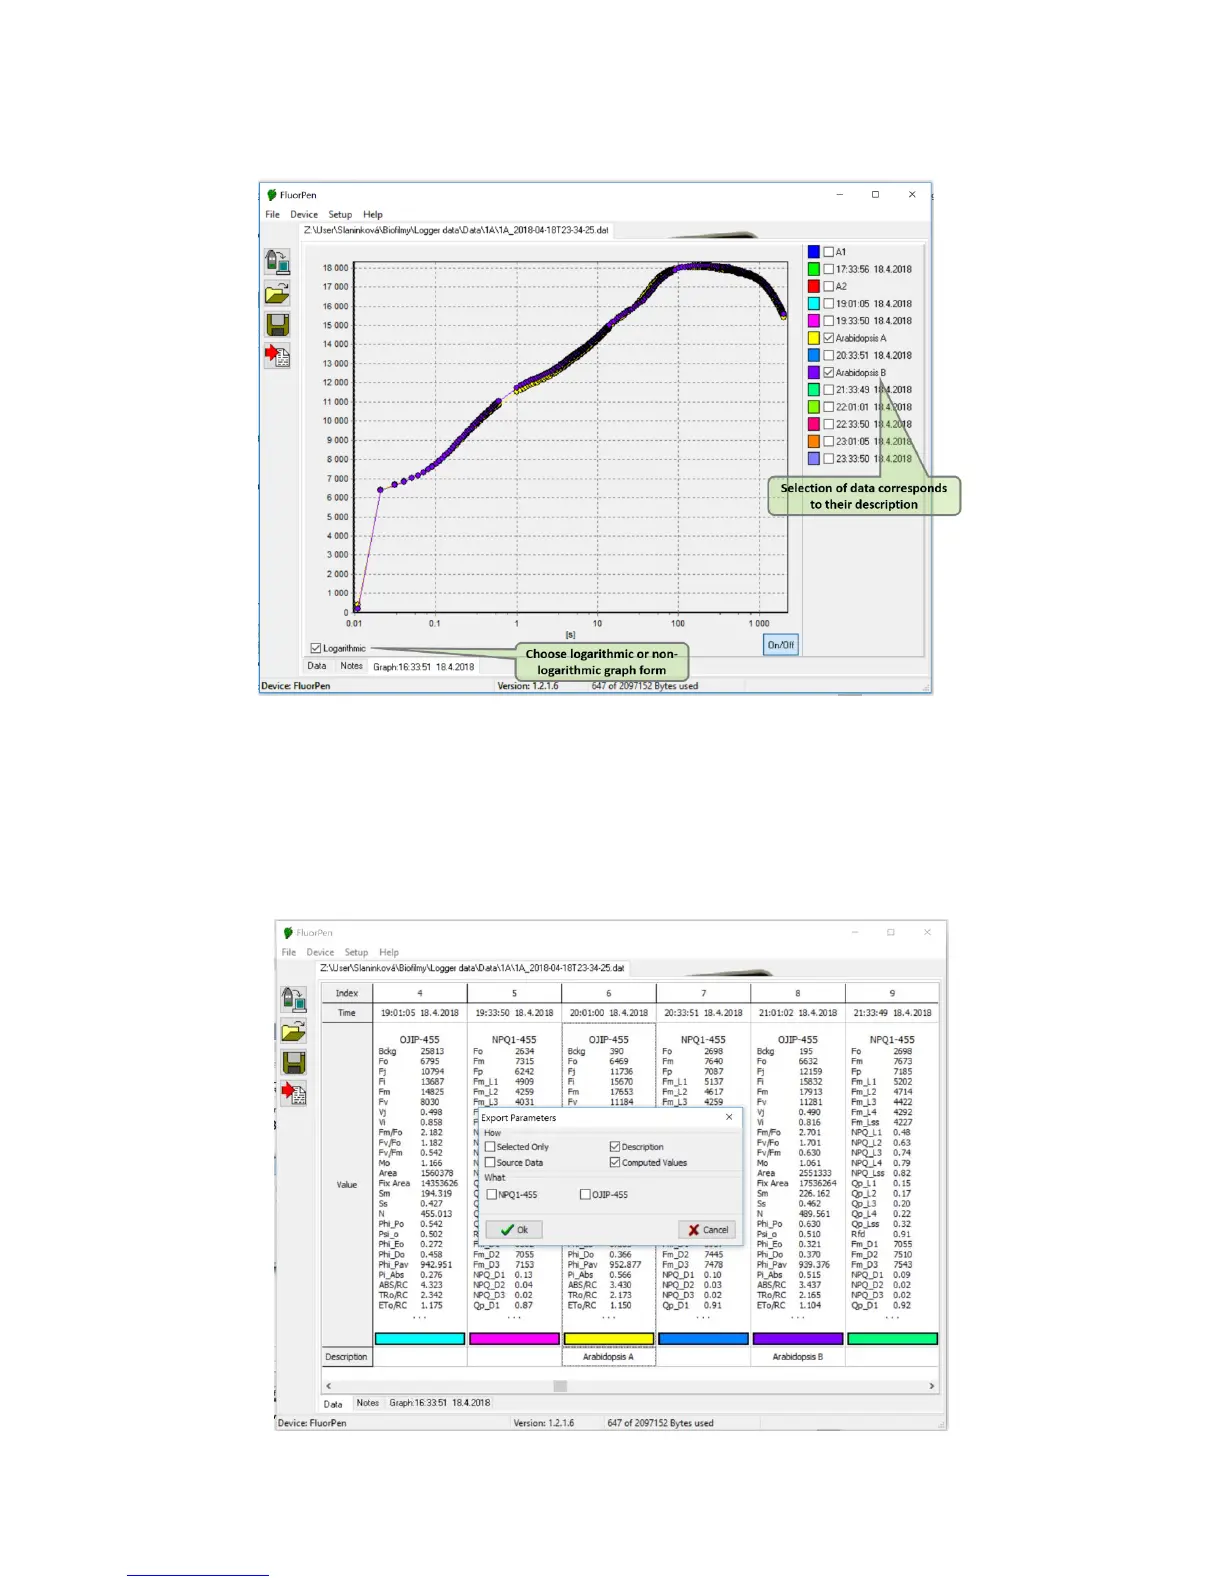
4. To visualize measurement in the graphic mode, click the Graph field in the bottom bar.
5. The colored Graph of measured data appears (Fig. 21).
Fig. 21 Graphic visualization of experiment.
6. For export press File > Export or Export icon, select what you want to export (Ft, QY, OJIP…) (Fig. 22).
Selected only – exports only one measurement that is selected by mouse, otherwise it will export everything.
Source data – exports raw data, in case of OJIP: points of the curve.
Description – exports the data description if any.
Computed values – export calculated data, in case of OJIP: F
0
, F
i
, F
j
...
Fig. 22 Export data.
 Loading...