21 pulsar 3
Data window (data)
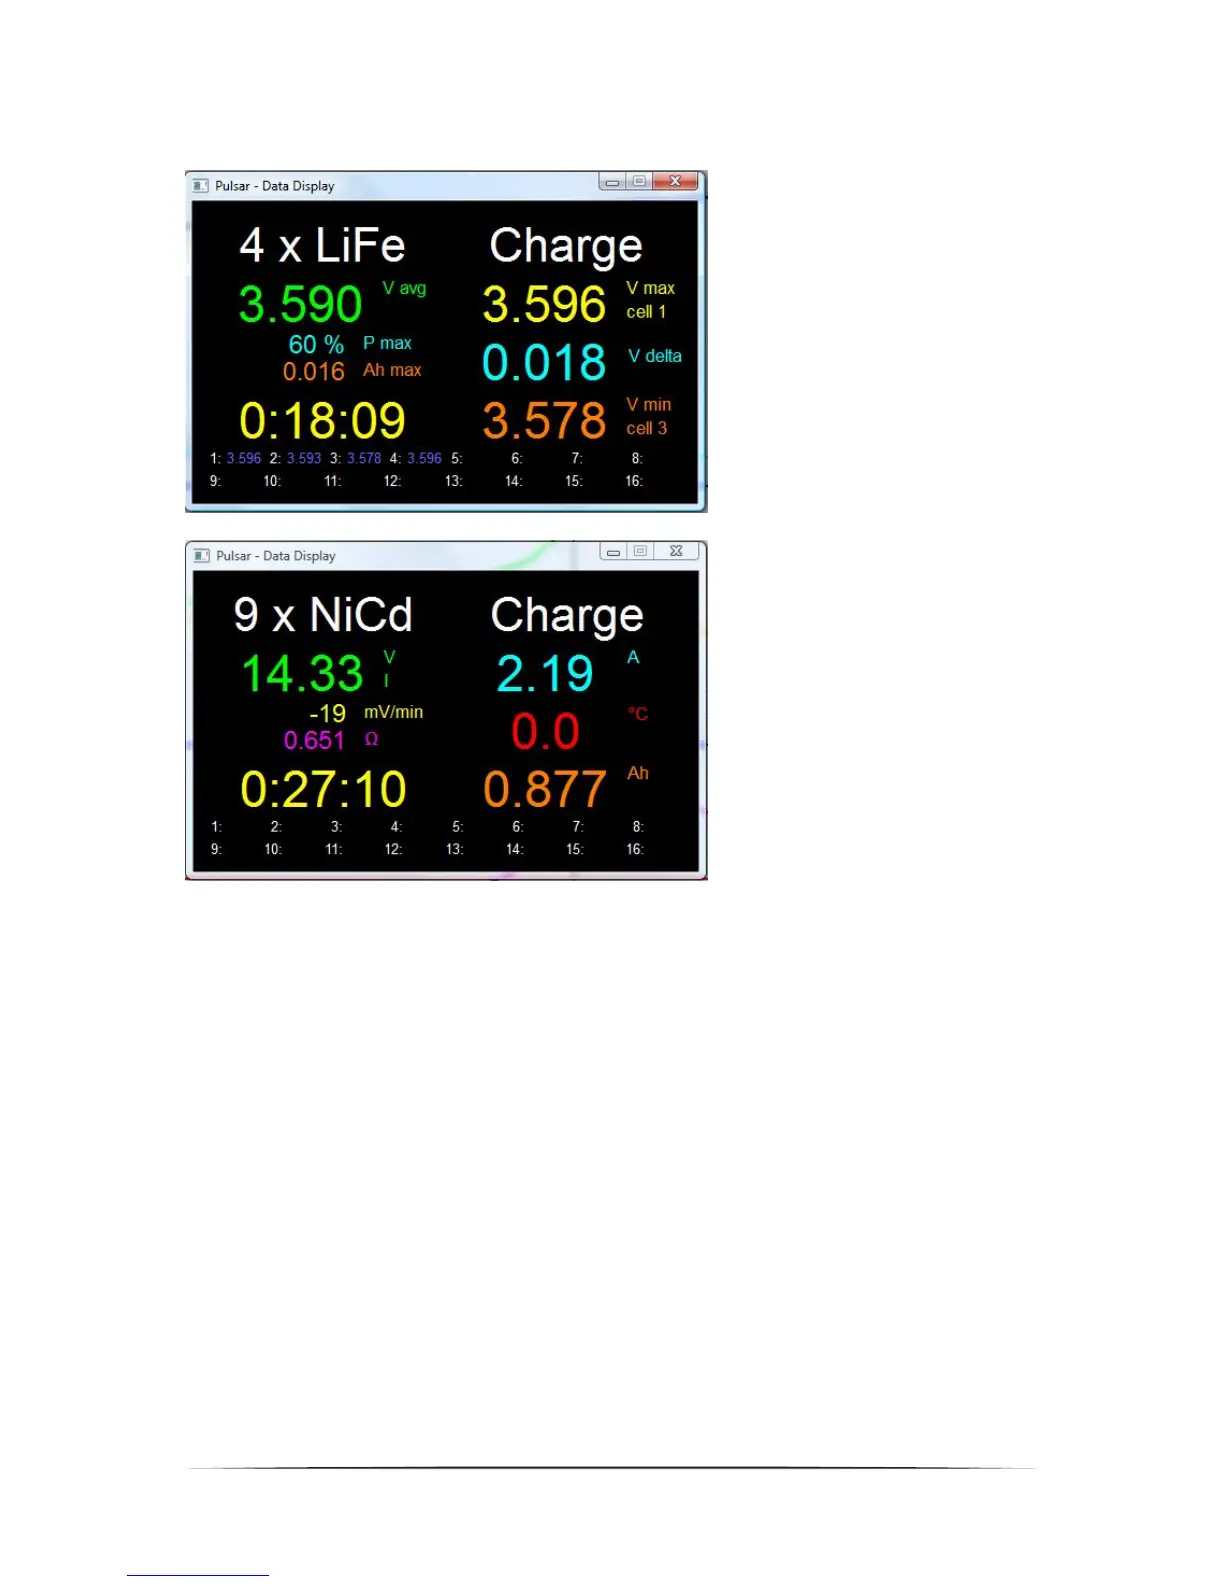
After clicking „Data“ a window pens containing the most crucial data from the process’ progress.
„Data” window, when the balancer is
active. A 4s-LiFe package is charged, the
average voltage (avg) is 3.590V, the
balancer operates on 60% power, the
strongest cell was balanced 0.016Ah, the
process duration is 18 minutes and 9
seconds, the strongest cell has 3,596V
(cell 1), delta (the difference between the
strongest and the weakest cell) of
0,018V, the weakest cell has 3,578V (cell
3). Voltage of all the cells in the package
is shown below.
„Data” window, when the balancer is not
active.
Package 9 x NiCd is charged, 14,33V, the
displayed „I” show that the inflex was
already recognized, current voltage
decrease in the package is -19mV/min
(the process is in the delta-peak
recognition phase), package resistance
(Ri) is 0,651Ω, process duration is 0
hours 27 minutes and 10 seconds, the
current current is 2,19A, 0,0°C – indicates
that the temperature indicator has not
been plugged in, charged 0,877 Ah.
„Voltage comparison “ window
In this window voltage curves from many processes (for example formatting or regeneration) can be compared..
After clicking (x1) in the upper left corner the estimated voltage per cell will be show.
The "S“ button will switch between: S, - or +. In the „S” position we mark the curves by clicking their number in the
window’s key (on the right side) while holding CTRL we can mark several curves. Another clicking of the “S”
button will disable the remaining “+” curves or disable marked “-“ curves.
„Capacity comparison “ window
The bar chart enables a quick capacity data comparison for singular processes (e.g. formatting). The red bar
shows discharge, the bright-red shows discharge after current reduction, green shows charging, bright-green – for
NiXX – shows the Inflex point after detection, and for the rest of the batteries – after charging current reduction of
after changing to impulse mode with Fast mode enabled.
When more then 8 windows will be opened at the same time – left and right arrows can be used to move the chart
(scroll).