10Operation of the Software PVPM.disp 29
In the diagram you can draw up a rectangle with the mouse cursor (from top left to bottom right with pressed left
mouse button). This marked region then will be displayed zoomed. To come back to normal view just click onto
the drawing region. If you press the Shift-Key and the right mouse button in the viewing area and keep the
buttons pressed, you can move the diagram area in every direction (pan).
A modification of the data is at present only possible in the fields irradiation and temperature: a doubleclick on
the displayed value opens a dialogue box, in which you can enter the new value. The changed values remain, if
the file is now stored to disk again.
Into the field „remark “you can write your notes. These are stored along with measured data. The first line of the
remarks is used as title of the diagram.
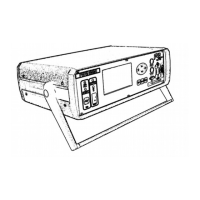
With the button “Clipb” you can copy important data in a tabular
form to the clibboard and then for example into MS Excel.
So you can easily setup a table of different measurements and
compare them using a software other then PVPM.disp without
exporting the files.
Clicking the viewing area with the right mouse button lets a
popup menu appear. The same functions are available if you use the
buttons on left of the diagram region. The following options are available:
10.4.1.1 MPP display on/off (button “Show MPP”)
You can select whether the MPP shell be displayed in the diagram or not.
Note: The displayed MPP is not exactly one of the measured data points
but will be interpolated and thus more precise
10.4.1.2 Theo. curve on/off (button “Eff. curve”)
You can select whether the effective solar curve will be calculated from the data and whether this curve will be
displayed additionally to the measured curve. Depending on the measured data this calculations may be
impossible.
10.4.1.3 Show STC curve on/off (button “STC curve”)
If a effective solar curve can be calculated it can be converted to STC conditions as well and also be displayed.
Here you can switch the display of this curve on or off. The axis scale will be corrected automatically (if
necessary).
10.4.1.4 Show power on/off (button “
You can select whether the power graph is displayed or not.
10.4.1.5 Zoom on/off (button “Zoom max”)
The Y-scaling is changed in such a way that the diagram uses the complete Y
axis.
10.4.1.6 Legend on/off (button “Legend”)
A legend of the displayed graphs can be displayed optionally. Here you can switch
the display of the legend on or off.
10.4.1.7 Copy to clipboard (button “Clipb”)
Copies the actual diagram to the clipboard, you can enter this copy for example
into a word document.
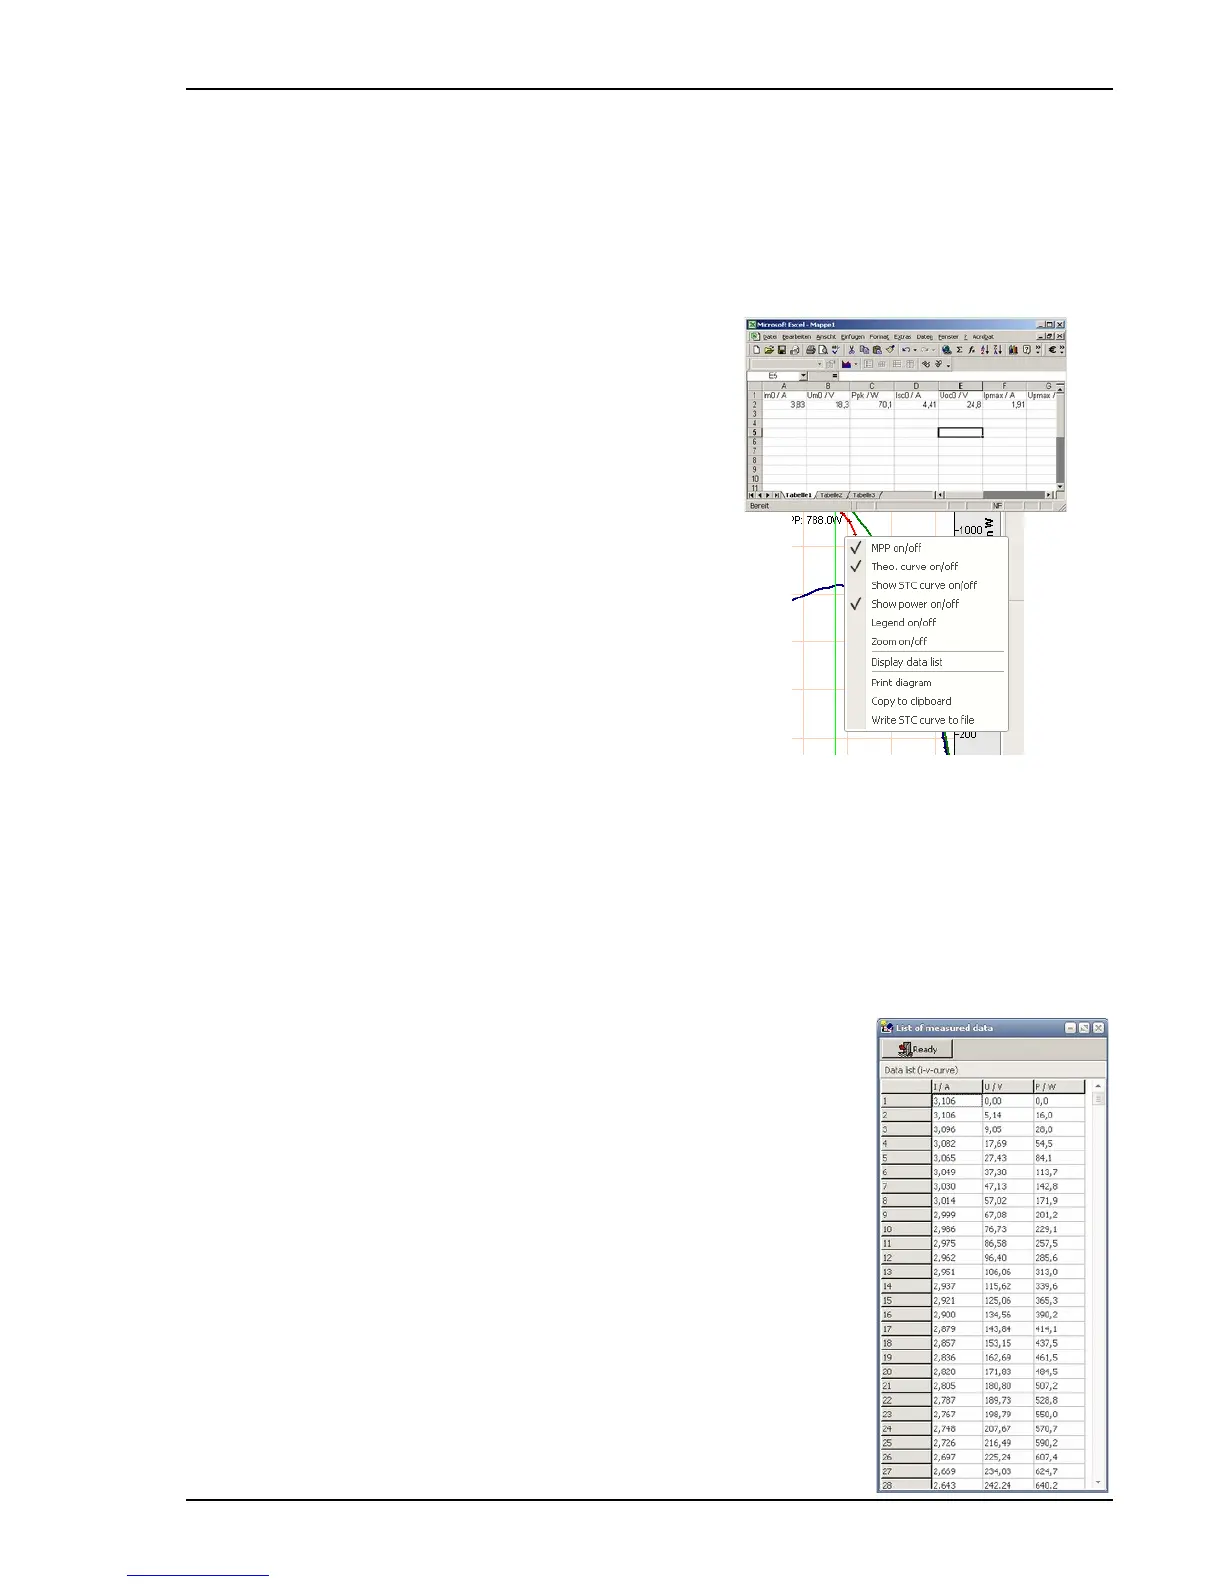
10.5 Results / Lists
By clicking the option ”Display data list“ in the local menu a window with the
measured characteristic data (in a list) appears.
Operation manual for PVPM devices PV-Engineering GmbH