15
D. Chart Recording
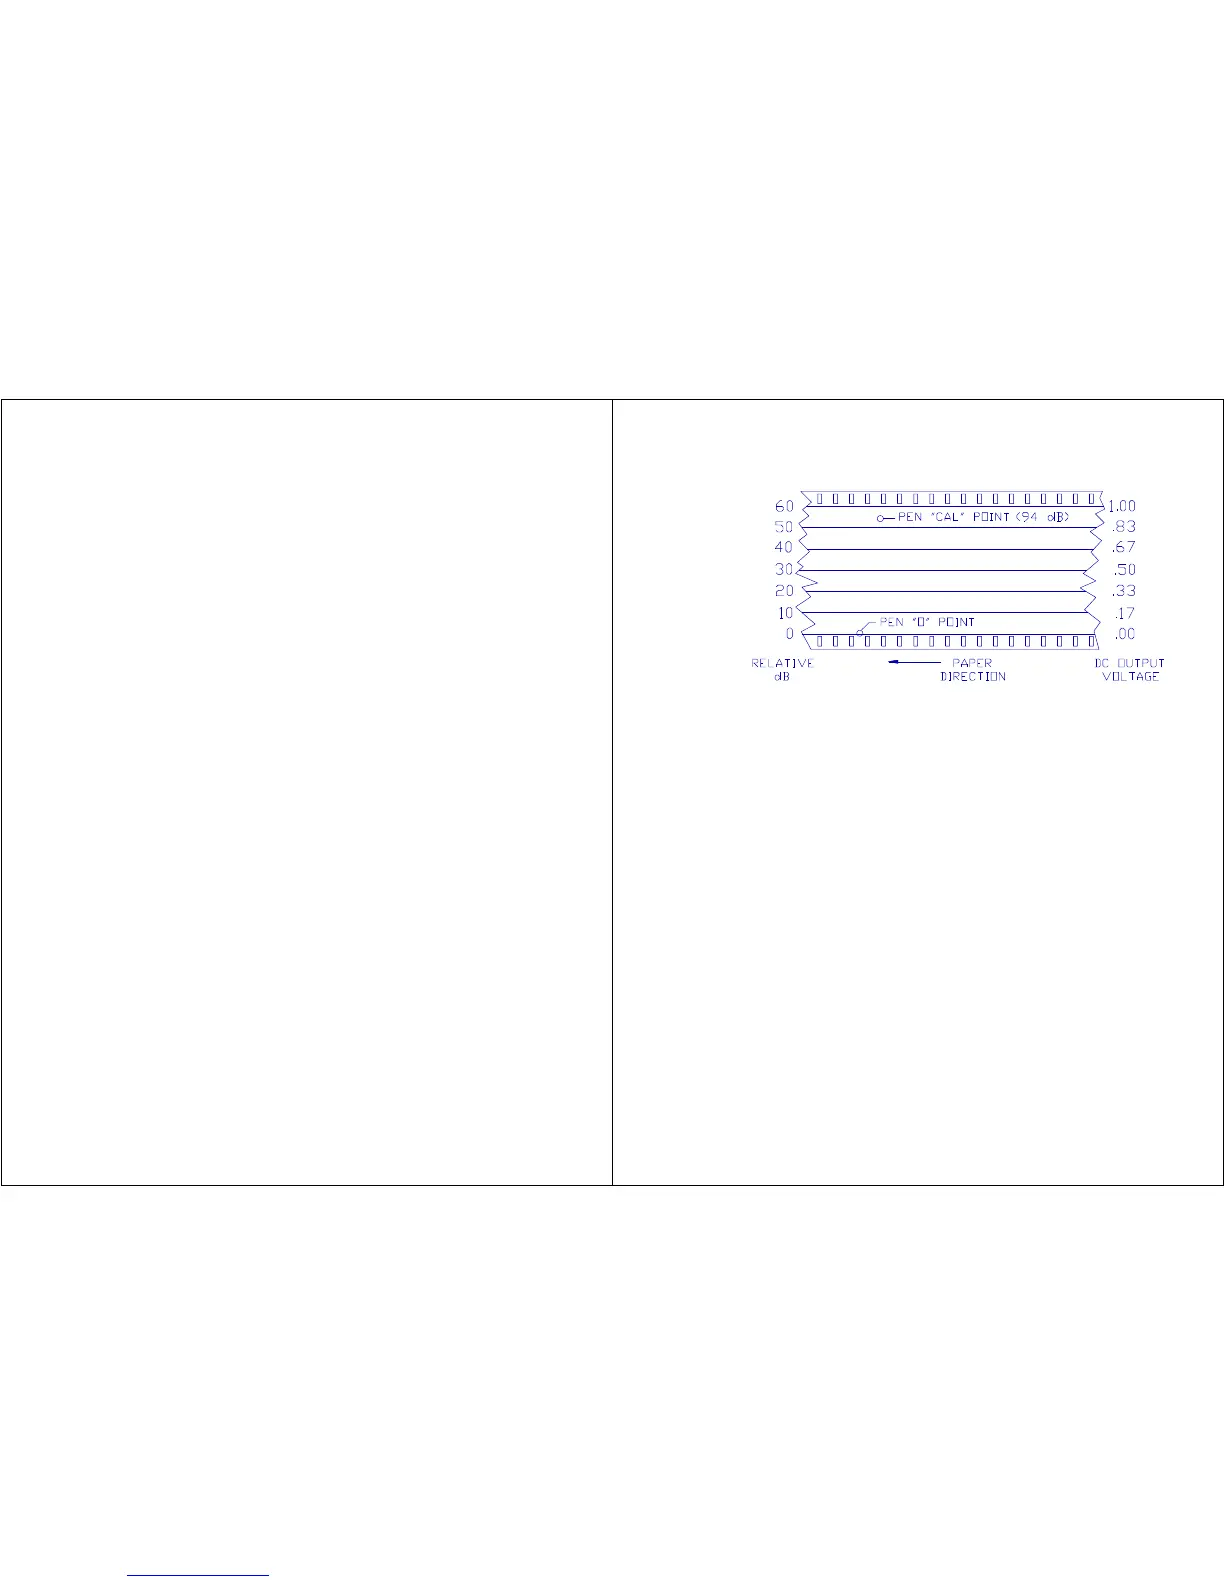
The Model 1800 has a DC output that is linearly related to the 60 dB LCD
analog bar movement as follows:
Analog Bar (dB) 0 10 20 30 40 50 60
DC Output (V) .00 .17 .33 .50 .67 .83 1.00
This output, capable of driving up to 100 feet of shielded or twisted pair
cable, is intended for use with a 0 to 1 volt DC input chart recorder that
has an input impedance greater than 20K ohms.
Refer to Figure 8, Chart Recording of SPL. Connect the Model 1800 to the
chart recorder input with proper polarity such that the pen is on the proper
side of the chart paper with respect to time and that the pen moves in the
proper direction with increasing dB level. Use a 1 kHz acoustic calibrator,
preferrably 94 dB, (dB level is specified on calibrator) to calibrate the
chart recorder as follows:
1. Turn the meter to ON. Set the meter RESPONSE to FAST, WEIGHTING to
A, MODE to SPL, and dB RANGE to 80-140.
NOTE: If an adapter is needed to mate the microphone size to the
calibrator coupler, insert it fully into the calibrator.
2. Place the calibrator (with adapter, if used) fully onto the
microphone - do not turn the calibrator on yet. The meter shall
read less than 80 dB which generates .00 volts DC out to the chart
recorder. Adjust the zero control on the recorder so that the pen
represents a relative dB of 0.
3. Turn the Calibrator ON to produce 94 dB (or the level specified on
the label) at 1 kHz. Set the 1800 dB RANGE for the highest bar
graph level without causing and overload. The recorder pen should
rise to the correct RELATIVE dB. (54 if the calibrator level is 94
dB and the dB RANGE is set to 40 to 100.) A small adjustment may
be needed. Use the zero adjust to do this.
4. Be sure to document all chart recorder settings and meter settings
when taking measurements.
Note that any range position can be set on the Model 1800 and the 60 dB span
of the meter range will always correspond to the full 60 dB range on the
chart recorder.
Use QUEST CHART PAPER # 58-653.
16
Figure 8. Chart Recording of SPL
E. Data
Logging
with the
NL-15
The Quest
Model
NL-15
Noise Data
Logger can
be used
with the
Quest
Model
1800.
When used
with the
meter, the
following
conditions
must be
observed:
1. Set the RESPONSE switch on the meter to FAST. (The NL-15 will
convert FAST to SLOW as required.)
2. Set the dB RANGE switch to either 80 - 140 dB or 60 - 120 dB. (If
used on other ranges, all data will be in error by either 20 dB or
40 dB.)
3. Set the WEIGHTING switch on the meter to either A or C. If other
weightings are used, the weighting data on the printout will be in
error. The rest of the readings will be correct.
In addition, the internal switches in the NL-15 must be set to agree with the
sound level meter settings.
1. If the meter is to be used on the 80 - 140 dB range, set NL-15
internal switch 1, position 4 to OFF. If the meter is to be used
on the 60 - 120 dB range, set NL-15 internal switch 1, position 4
to ON.
2. If the meter is set to A-weighting, set NL-15 internal Switch 1,
position 3, to OFF.
If the meter is set to C-weighting, set NL-15 internal switch 1,
position 3, to ON.