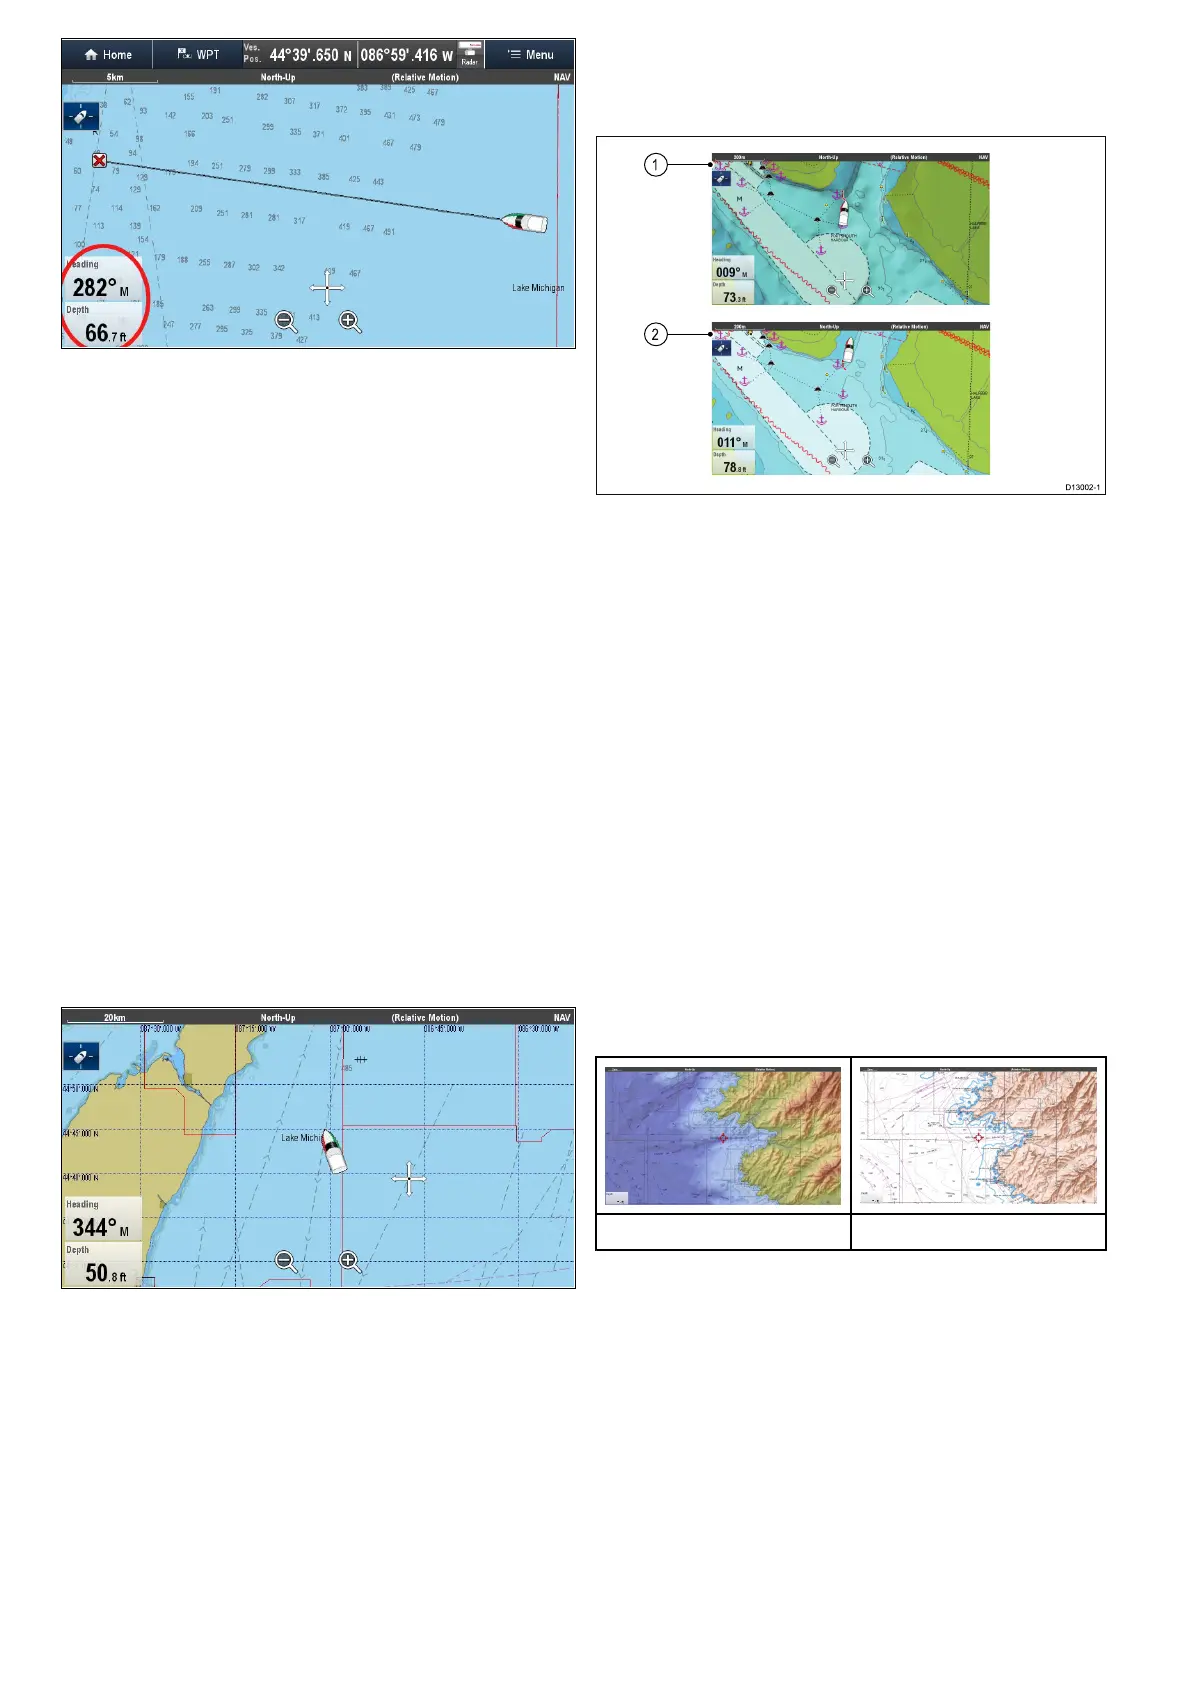
Customizingdataboxesinthechartapplication
Toswitchdataboxesonandoffandtoselectdatato
displayfollowthestepsbelow.
FromtheChartapplicationmenu:
1.SelectPresentation.
2.SelectOverlay.
3.SelectDataboxes.
4.SelectDatabox1>On.
5.SelectDatabox2>On.
6.ChoosetheSelectDataoptionfortherelevant
databox.
7.Selectthecategorythatreectsthetypeofdata
youwanttodisplayinthedatabox.Forexample,
Depthdata.
8.Selectthedataitem.
Thedatayouselectedisdisplayedonscreenin
theappropriatedatabox.
Chartgrid
YoucanoverlayagridontotheChartapplication
TheChartgridrepresentsthelinesoflatitudeand
longitude.
BydefaulttheChartgridisswitchedoff.
Switchingthechartgridonandoff
TheChartgridcanbeswitchedonandoffby
followingthestepsbelow.
FromtheChartapplicationmenu:
1.SelectPresentation.
2.SelectOverlays.
3.SelectChartGrid:sothatOnisselectedtoturn
thegridon,or
4.SelectChartGrid:sothatOffisselectedtoturn
thegridoff.
2Dshading
Ifsupportedbyyourcartographytype,youcan
switchshadingoflandandseacontoursonandoff.
1.2DshadingOn.
2.2DshadingOff
Bydefault2Dshadingisswitchedon.
Switching2Dshadingonandoff
2Dshadingcanbeswitchedonandoffbyfollowing
thestepsbelow.
FromtheChartapplicationmenu:
1.SelectPresentation.
2.SelectOverlays.
3.Select2DShading:sothatOnisselectedto
turntheshadingon,or
4.Select2DShading:sothatOffisselectedto
turntheshadingoff.
Reliefshading
ReliefshadingisavailablewhenusingJeppesen
®
cartographyandprovidesanoverlaythatindicates
thedepthandaltitudeofterrain.
ReliefshadingOnReliefShadingOff
Switchingreliefshadingonandoff
FromtheOverlaysmenu:Menu>Presentation
>Overlays.
1.SelectReliefShading:sothatOnisselectedto
turntheshadingon,or
2.SelectReliefShading:sothatOffisselected
toturntheshadingoff.
182
LightHousemultifunctiondisplayoperationinstructions
 Loading...