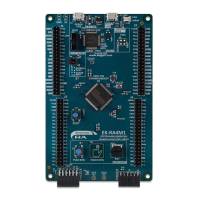
Renesas RA Family FPB-RA2E1 v1 – User's Manual
R20UT4956EG0100 Rev 1.00 Page 13 of 24
Jul.23.21
5.2 Debug and Trace
The FPB-RA2E1 board can be programmed and debugged using the built-in E2 Emulator On-Board
debugger.
5.2.1 E2 Emulator On-Board
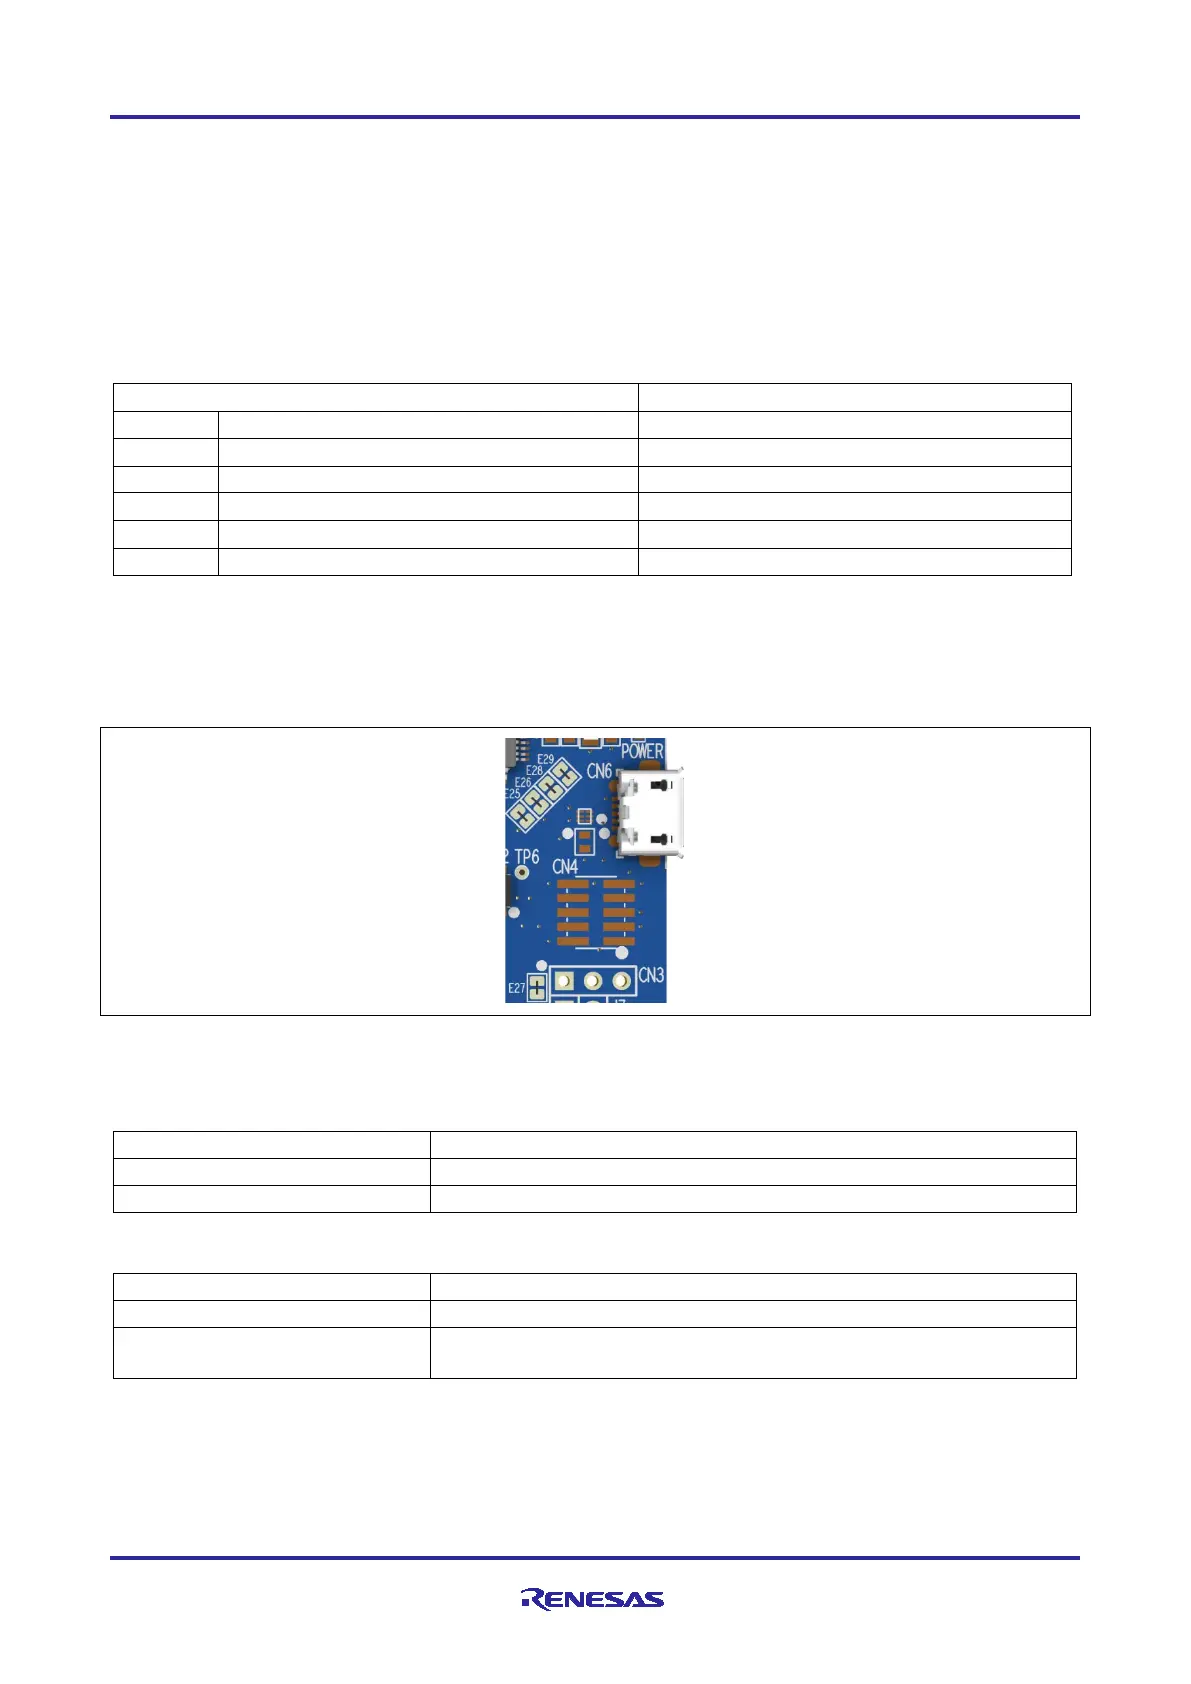
Debug USB micro-B connector (CN6) connects the E2 debugger to an external USB full speed host, allowing
re-programming and debugging of the target RA MCU firmware.
The E2 Emulator On-Board debugger connects to the target RA MCU using the SWD interface.
Table 3. Debug USB Connector
USB ID, jack internal switch, cable inserted
A green indicator, LED3, shows the visual status of the debug interface. When the FPB-RA2E1 board is
powered on, and LED3 is blinking, it indicates that the E2 Emulator On-Board debugger is not connected to
a programming host. When LED3 is on solid, it indicates that it is connected to a programming interface.
When LED3 is flickering, it indicates that data is being transferred between the E2 Emulator On-Board
debugger and the programming host.
Figure 7. FPB-RA2E1 Debug Interface
5.2.1.1 Debugger Jumper Settings
Table 4. Debug Jumper CN1
Debugger held in reset (RA2E1 MCU free-running operation)
Table 5. Debug Jumper CN3
Puts the RA2E1 MCU into SCI Boot Mode. See the RA2E1 MCU
hardware manual for further details
5.2.2 External Debugger
The 10-pin Cortex
®
Debug Connector at CN4 supports JTAG, SWD and ETM. This connector may be used
for external debug of the target RA MCU.
 Loading...