13
If the bars are not filled at all, the RF output stage or/and the detector are not working
properly in the analyzer.
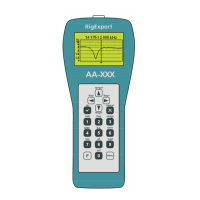
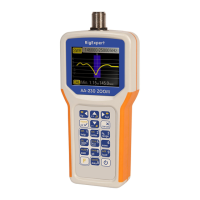
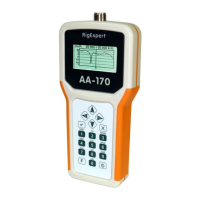
3 – detector output voltage vs. frequency graph. With no load at the antenna
connector, the display should look like shown on the picture:
The voltage curve should stay between the horizontal dotted lines. The vertical
lines are the bounds of analyzer’s subbands.
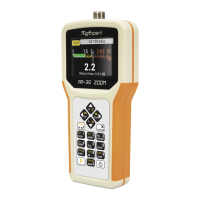
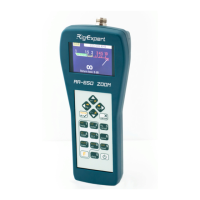
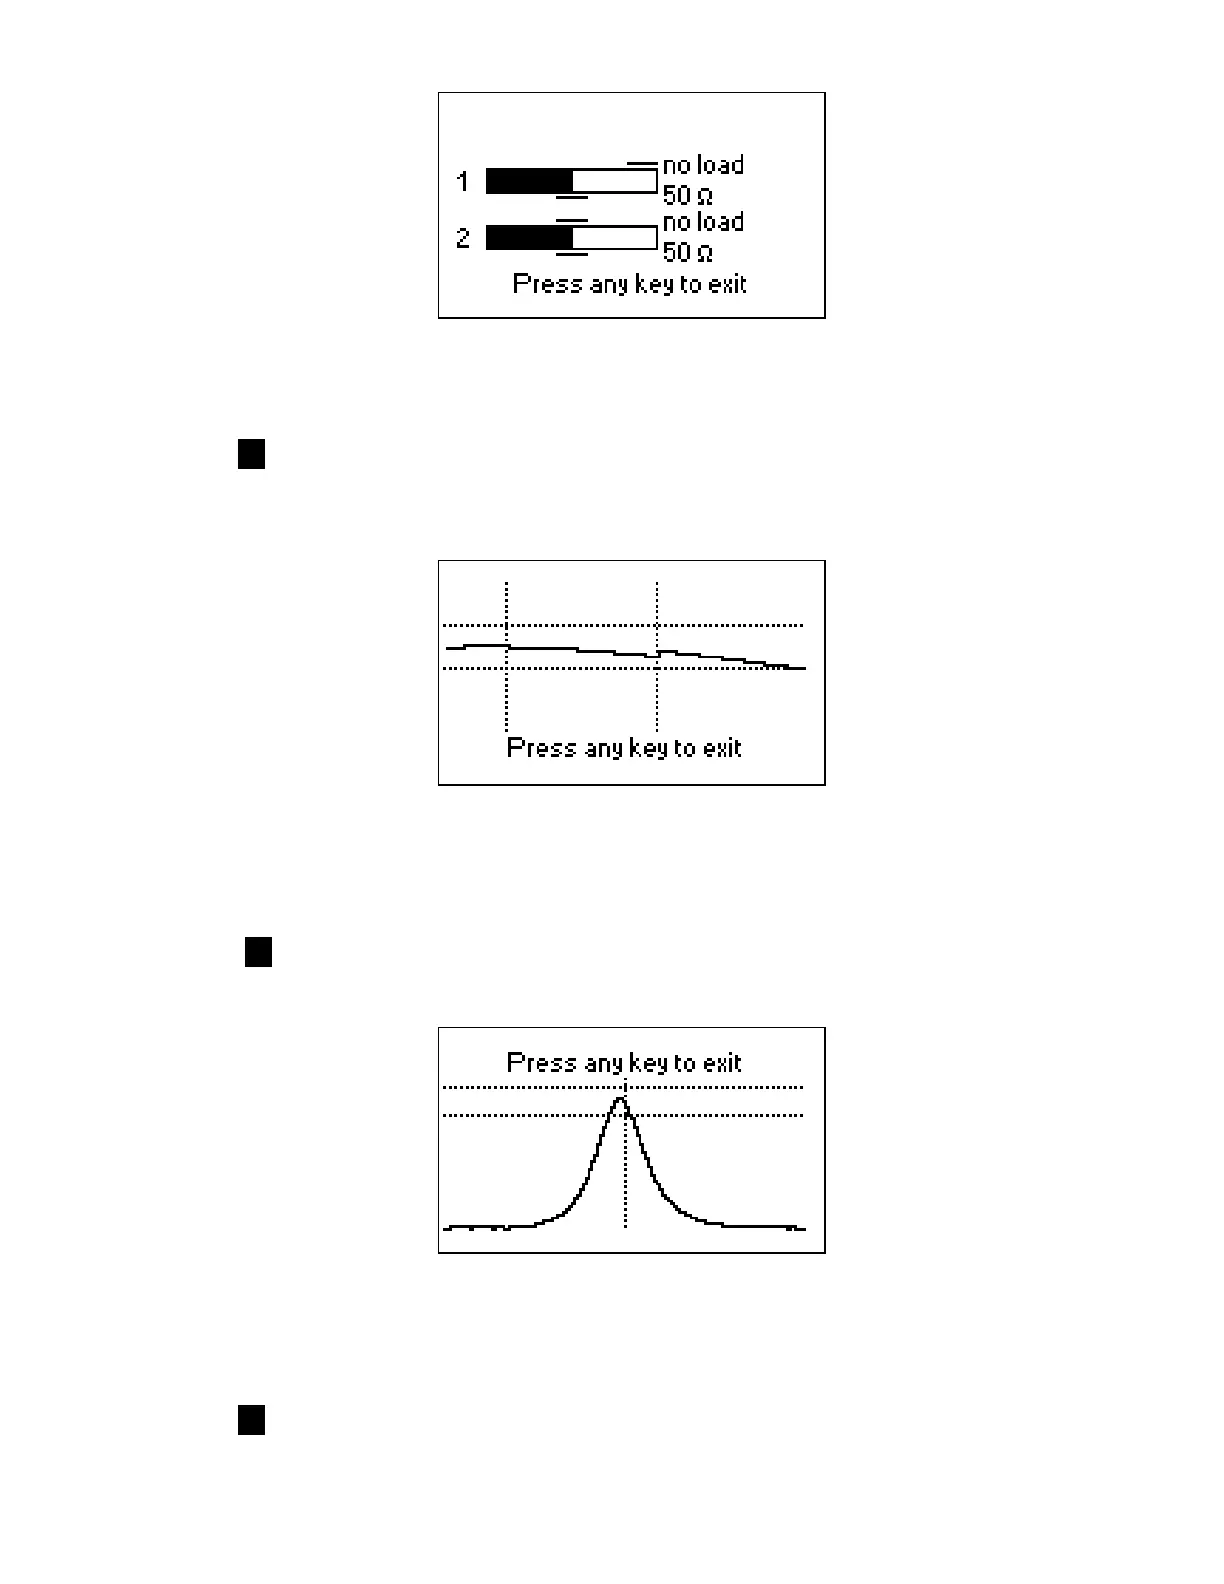
4 – bandpass filter frequency response graph. With no load at the antenna
connector, the display should look like shown on the picture:
4
The top of the curve should be located in the middle of the screen, between
the two horizontal dotted lines. A small horizontal shift of the curve is
allowed.
0 – go to the fourth page of settings which contains reset commands.