H1 Series
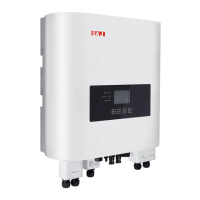
Energy Direction
2019-09-16 18:26:31
1200W 500W
2000VA
50.8W
Figure 6.10 Power flow illustration(System running normally)
If system running in different states, power flow illustration will change as
states. For example, when in Off-grid state, cut off the Grid, the dynamic
power flow arrow will disappear. When no PV power, the PV dynamic power
flow arrow will disappear. When no load output, the load output dynamic
power flow arrow will disappear.
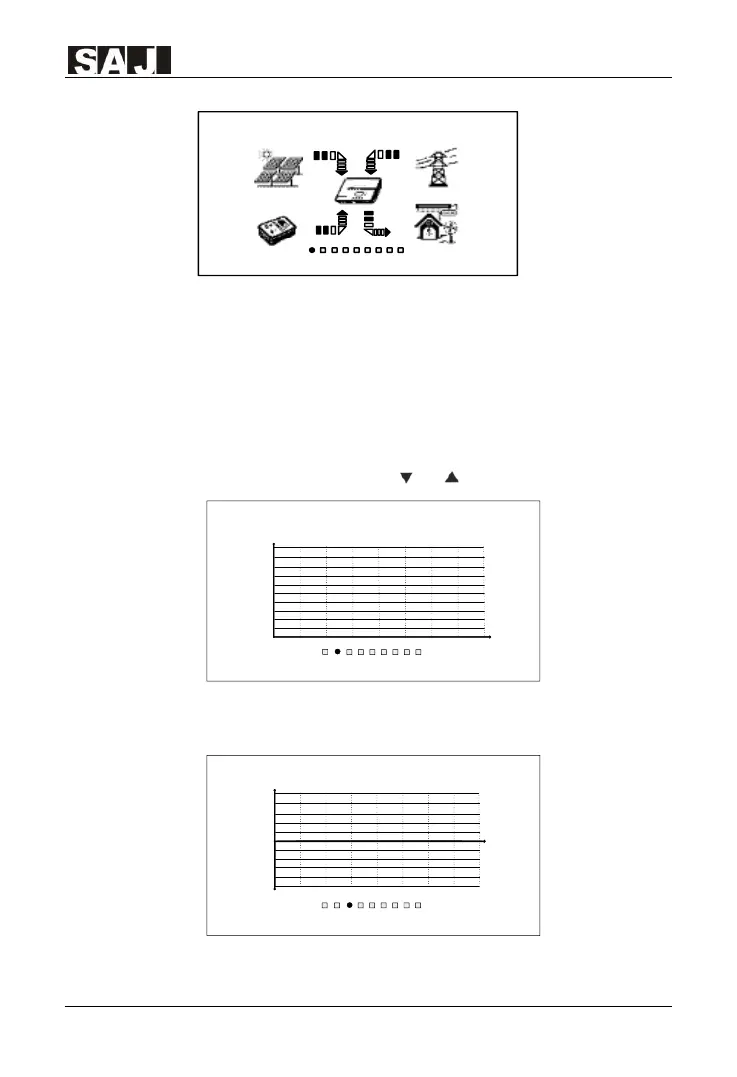
In system main screen, user could press or to view different charts.
PV Power
E-Today 0.00kwh
2019-08-14 18:26:31
03691215182124hour
kw
0.6
1.2
1.8
2.4
3.0
3.6
4.0
4.6
5.0
5.4
Figure 6.11 PV power and daily generation
Grid Power
2019-08-14 18:26:31
-3.0
3691215182124hour
kw
-2.4
-1.8
-1.2
-0.6
0
0.6
1.2
1.8
2.4
3.0
kw
Sell: 0.00kWhBuy: 0.00kWh
Figure 6.12 Power Trading of Grid and daily generation
 Loading...