59
Data Output
There are three options for data output:
– Output to the moisture analyzer
– Output to an internal printer (option)
– Output to a peripheral device (e.g., computer, external printer, PLC) via the interface port
Output to the Moisture Analyzer (Weights and Calculated Values)
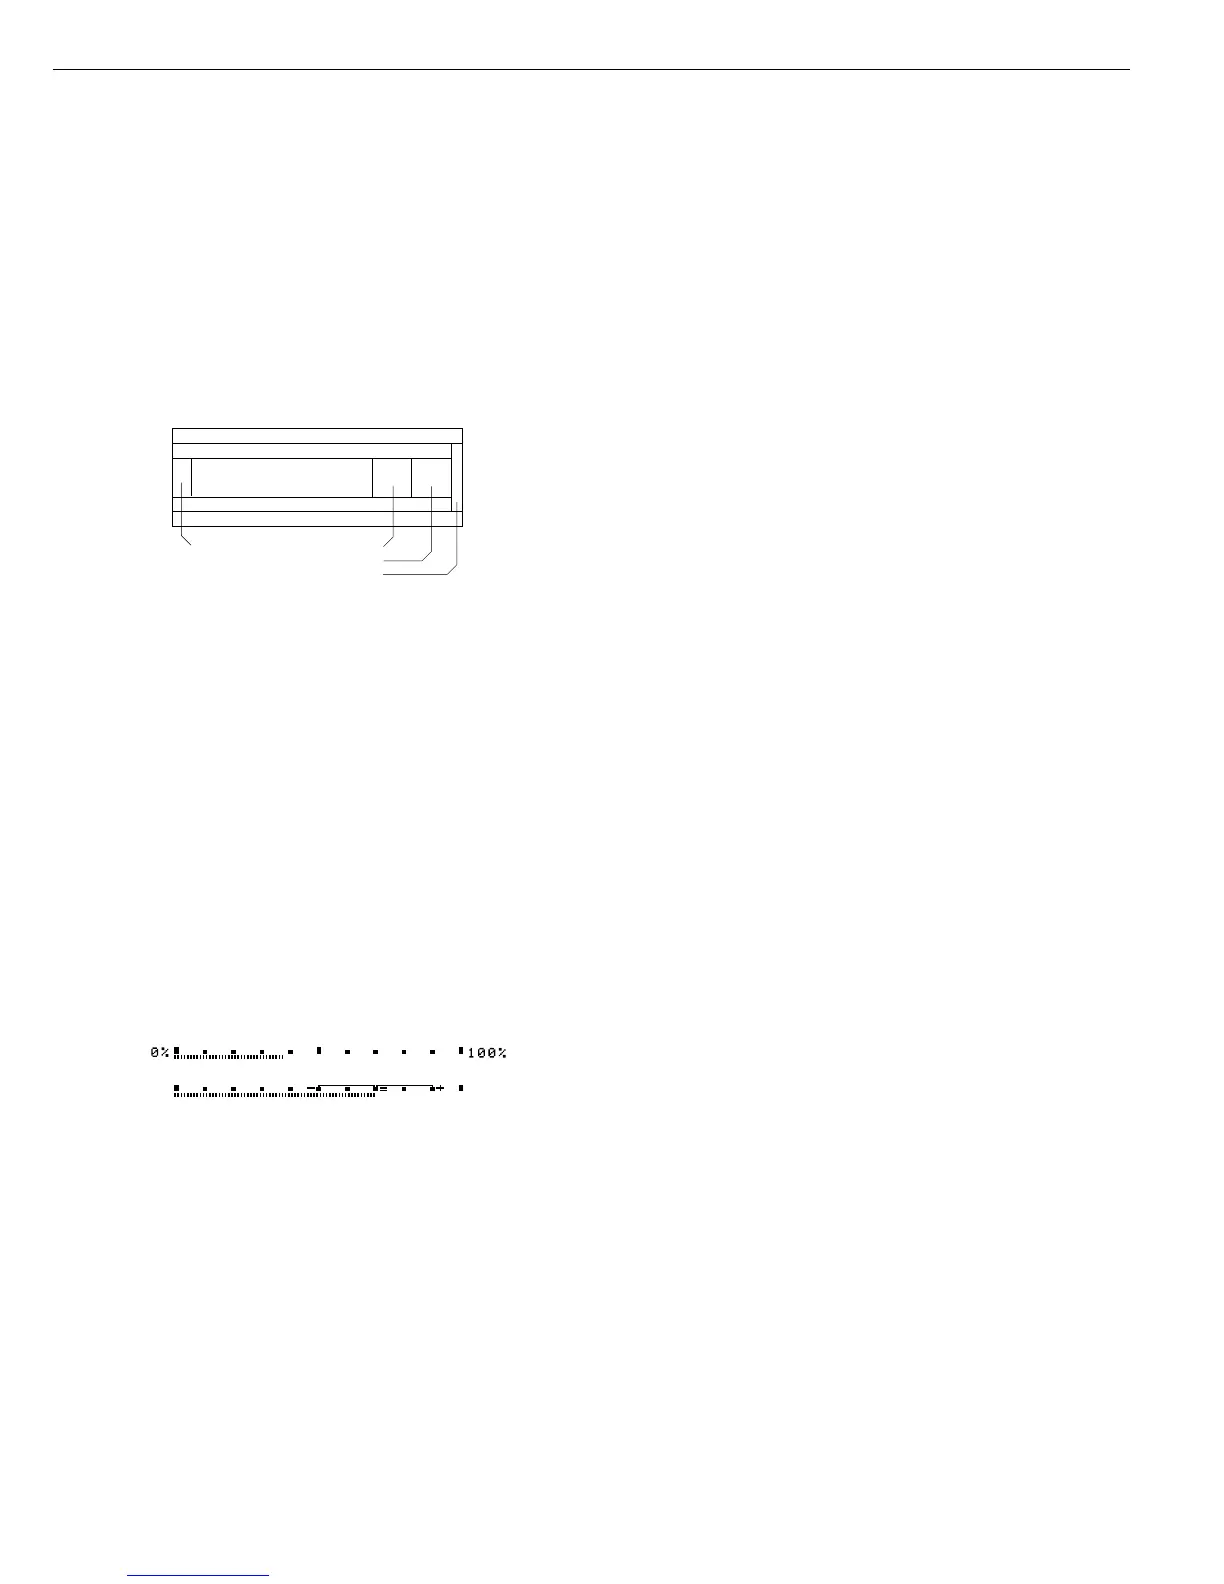
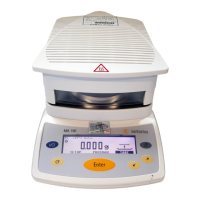
The display is divided into 9 sections. Information about the weighing system, the
application being used and the sample weighed is output in the following sections:
– Drying program info
– Bar graph
– Plus/ minus sign, stability symbol display
– Line for moisture analysis values
– Weight unit display
– Drying symbol
– Application symbol display
– Text line
Drying Program Info
In this line, drying program data is displayed:
– Program number
– Temperature data (for example: phase drying)
– Shutoff parameters
Bar Graph (Overview Display)
In the bar graph, weighing results are displayed either
– as a percentage of the maximum weighing system capacity, or
– in relation to a target value, with the tolerance limits indicated.
The bar graph is displayed if either “Minimum and maximum initial weight” or
“Target weight, tolerance in %” for initial weight is selected in the drying program.
Plus/ Minus Sign, Stability Symbol
This section shows:
– “Busy” symbol
– Plus or minus sign
J
F H


 To Next Page