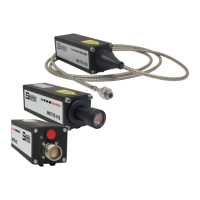
METIS M311 / M322 / H311 / H322 (17-pin)
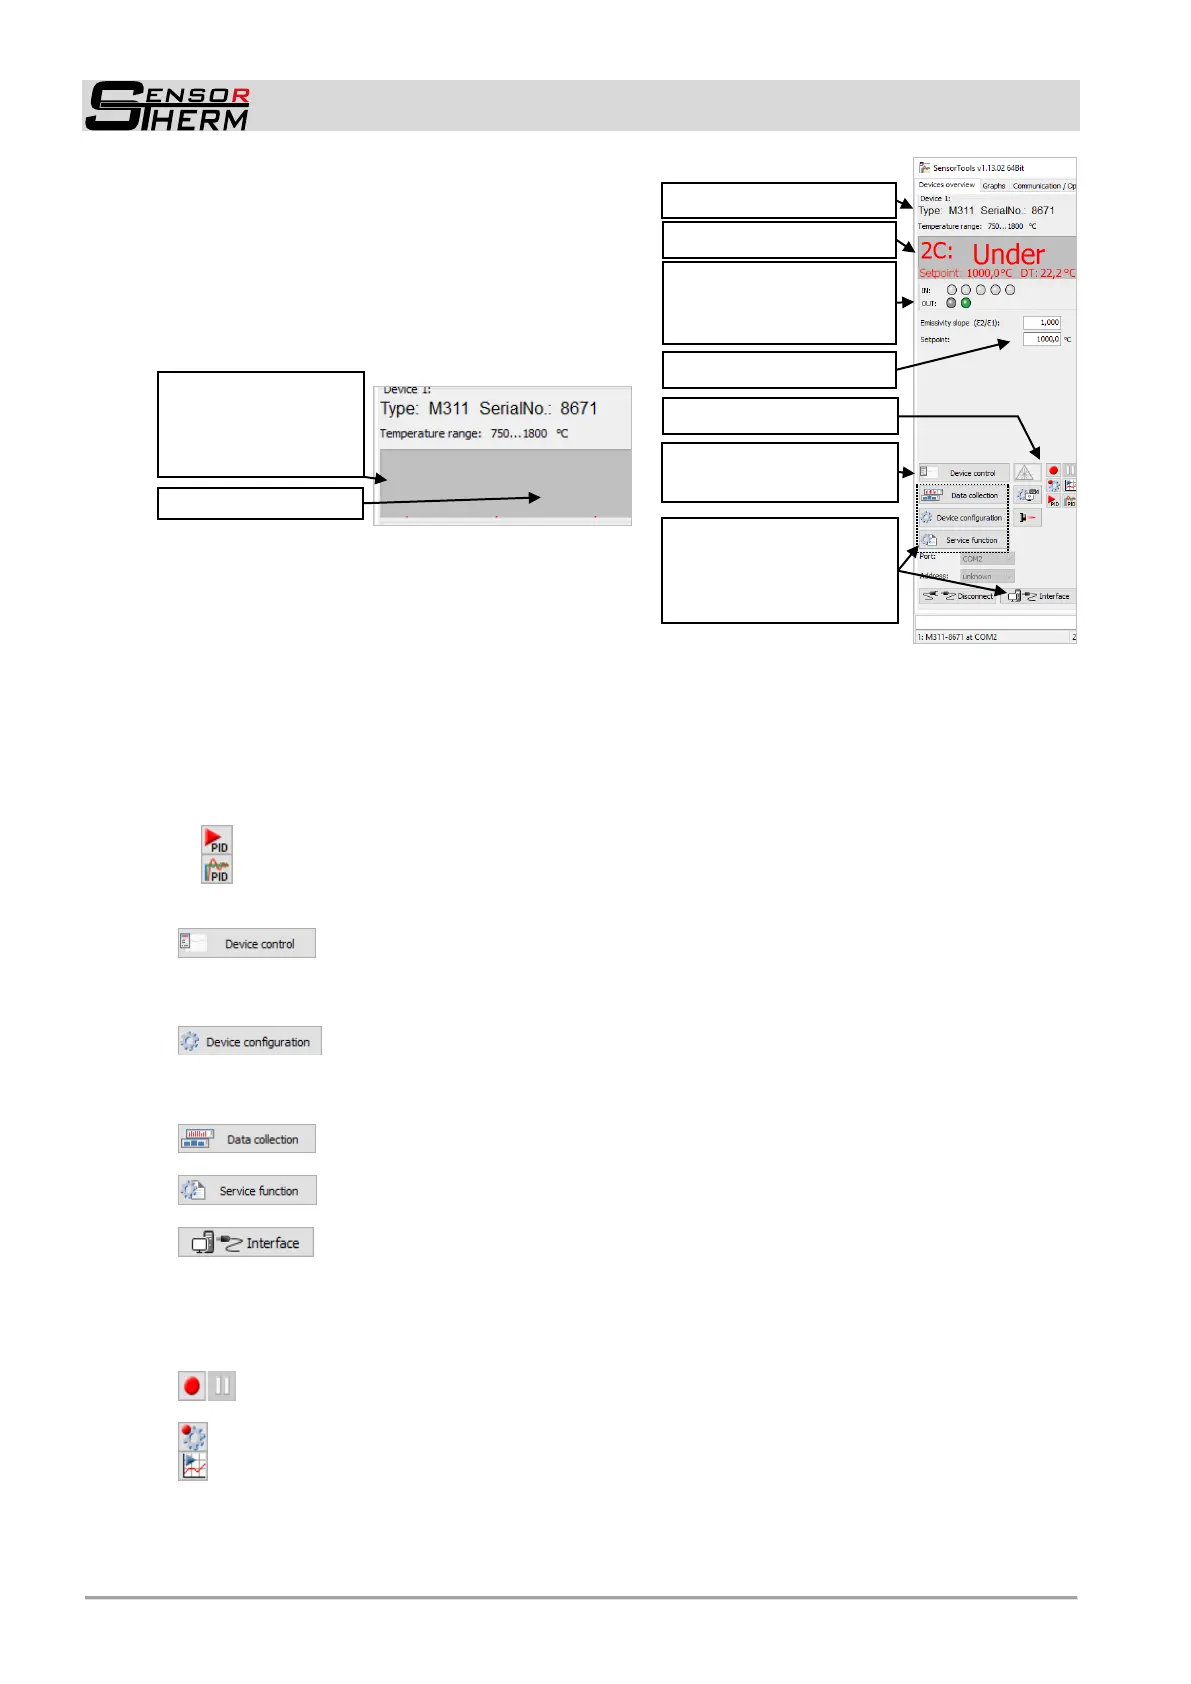
SensorTools Software
26
An identified pyrometer directly shows the current
measuring temperature in the preselected measuring
mode (2C for 2-color temperature, C1 or C2 for 1-color
temperature (channel 1 or channel 2) in this connec-
tion window as well as in the control window, and
graphically in the main window in the graph-tab as well
as the internal device temperature (DT).
Essential measuring parameters can be entered via
basic device-specific input fields:
The emissivity slope must be taken into account for measurements in the 2-color mode (2C) and
adapted for the respective measuring material in order to obtain correct measured values (also see
6.1)
The emissivity must be taken into account for measurements in 1 channel mode (C1 or C2) during
the measurement, and adapted at the pyrometer for the respective measuring material in order to ob-
tain correct measured values (also see 6.2)
The setpoint for the PID controller, see 7.2.4)
- Via the PID start button the control process can be started directly.
- The control parameters can be defined in the controller window (see 7.2.4)
Further measurement parameters can be found here:
Opens a separate control window (see 7.2 and 7.2.2) to access all measurement-
relevant functions and settings when switching to other tabs (e.g. the graph view).
Device settings are made here:
Via the device configuration basic device settings are made (see 7.2.3).
The following settings can also be accessed from the "Device configuration", but can be found here
again for quick access:
The data collection settings control the transmission of measured data from the py-
rometer to the PC (also see 7.2.3.4).
Service functions are used to back up, print, or restore device parameters, or create
service files for remote diagnostics in the event of a problem (see 7.2.3.2).
Interface (see 7.2.3.3) allows the display and / or setting of
- the set interface RS232 or RS485 (changeover directly on the device)
- the baud rate (see 6.12)
- the device address (see 6.14)
- the interface or answer delay (see 6.15)
The recording function is used, as also in the graph window, to record the transferred meas-
ured value data for subsequent analysis to the hard disk (also see under 7.2.1 Information field).
opens the Data recording settings (under chapter 7.2.1)
The playback button starts the SensorTools viewer (see 7.3) and represents the last temporarily
stored measurement data, since the device was connected. These are not stored on hard disk as in
recording, only buffered. The amount of data depends on the value "Maximum records in memory"
(see Data recording settings). Each measurement storage consists of a data set: measurement
2C: Measuring tempera-
ture (at temperatures
below beginning of the
temperature range, the
software shows “Under”)
Separate control window
(see 7.2 and 7.2.2)
Device configuration,
data collection settings,
service functions and
interface settings
Status of the digital in-
puts / outputs (see
7.2.3.1)
 Loading...