LED1 (color) LED2 (color) Description
Ö (Red) Ö (Red)
Fatal error
O (Green) O (Green)
On / Ready for operation
O (Yellow) Ö (Yellow)
Waiting for restart
Ö (Green) Ö (Green)
Standby
O (Green) Ö (Yellow)
Restart after time
Ö (Yellow) Ö (Yellow)
EasyTeach / teach-in
Ö (Green) Ö (Red)
Alignment mode
O = illuminated; Ö = flashing
4 Mounting
•
The device should be as free from shock and vibration as possible during
operation.
•
Protect the sensor from direct sunlight.
•
In applications with temperatures near the maximum ambient operating
temperature, fasten the device firmly on a metal holder with the optional
bracket to conduct heat away from the device.
1. Mount the LiDAR sensor on a prepared bracket.
2. Align the horizontal 0° axis of the LiDAR sensor’s field of view with the cen‐
ter of the area to be monitored. The marking on the lid of the optics cover
serves as a bearing alignment aid.
5 Electrical installation
1. Connect the communication interface (Ethernet, 4-pin M12 female connec‐
tor) of the LiDAR sensor directly to the PC.
2. Switch on the PC.
3. Supply the LiDAR sensor with voltage (5-pin M12 male connector, supply
voltage 10 ... 30 V).
✓ After successful initialization, the two status LEDs light up green. The device
is ready for use.
6 Configuration without PC
6.1 Field evaluation
Configuration is performed by teaching in (EasyTeach) of the surrounding contour
in order to automatically generate a field with any shape, including more complex
shapes. In the as-delivered configuration, the teach-in phase is activated and
deactivated using the wiring for input IN4.
Preparing EasyTeach
•
Remove all objects that will not permanently be in the field of view in moni‐
toring mode later on.
•
Distance yourself sufficiently from the device during the teach-in phase and
do not enter the monitored area, so that you are not detected as part of the
field contour.
Teaching in the field contour
•
The device forms the field from the surrounding contour with a negative off‐
set of 100 mm.
•
The field shape to be formed can be defined by pacing out the limits during
the teach-in phase. It is important to make sure that the person can always
be unequivocally detected.
•
The device stores the shortest value measured during the teach-in phase as
a field limit for each angle.
•
Note: A parameter upload is required in order to display the newly taught-in
field contour in SOPAS.
1. Install the device.
2. Carry out the EasyTeach wiring.
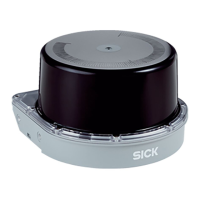
Vs 10 … 30 V
Reserved
IN8/OUT8
GND
Reserved
1
2
4
3
5
PWR
IN1/OUT1
IN2/OUT2
IN3/OUT3
IN4/OUT4
IN5/OUT5
IN6/OUT6
GND INx/OUTx
IN7/OUT7
6
7
8
I/O
1
7
2
6
5
4
3
8
1
4 3
5
2
Vs
GND
Vs
Teach-In
1
2
1
2
3
4
5
GND
Figure 5: Wiring for EasyTeach (example)
1
Teach-in via an external signaling device such as a pushbutton,
at input IN4/OUT4 in this example.
2
Feedback for field infringement; at input IN6/OUT6 in this exam‐
ple
3. Set the EasyTeach input signal to start the teach-in phase (active high).
4. Define the field (e.g., using the existing surrounding contour or by pacing out
the field).
5. Remove the EasyTeach input signal to end the teach-in phase (active high).
6. Thoroughly check correct detection of the field borders by performing a func‐
tional check in which field infringements are intentionally caused.
7 Configuration with PC
The SOPAS ET configuration software (from Version 3.3.3) is used as standard to
display the surrounding contour (measuring line) recorded by the LiDAR sensor, as
well as diagnostic information in the event of an error.
7.1 Installing and starting the configuration software
1. Download and install the latest version of the SOPAS ET configuration soft‐
ware, as well as the current device description files (*.sdd): www.sick.com.
In this case, select the “Complete” option as suggested by the installation
wizard. Administrator rights may be required on the PC to install the soft‐
ware.
2. Start the “SOPAS ET” program after completing the installation. Path: Start >
Programs > SICK > SOPAS ET Engineering Tool > SOPAS.
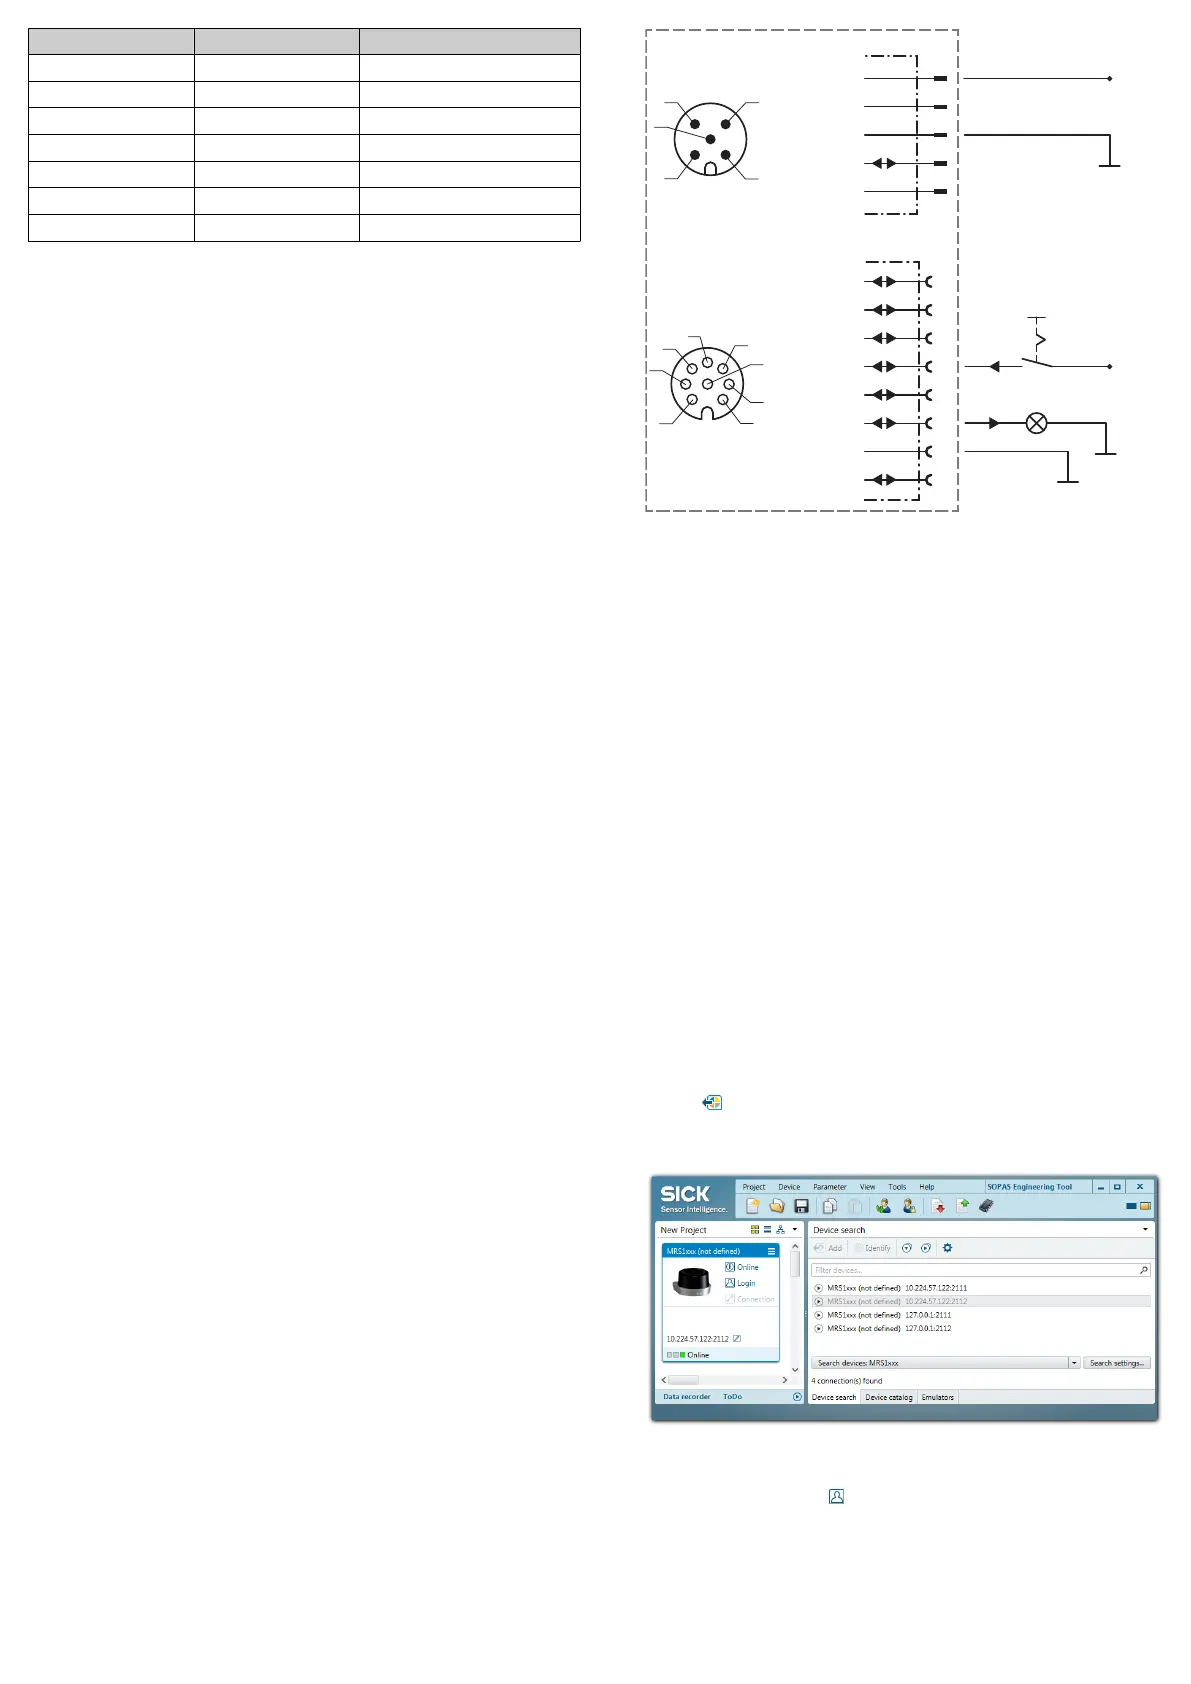
✓ SOPAS ET automatically starts searching for connected devices and displays
connected devices in the Device search window.
3. Select the appropriate LiDAR sensor from the list of available devices:
°
Use MRS1xxx (port 2111) to configure the device.
°
Use MRS1xxx (port 2112) to view only measured data.
If necessary, install an updated device description file for the device.
4.
Click on
Add to establish communication.
✓ SOPAS ET establishes communication with the LiDAR sensor, loads its cur‐
rent device description (parameters), and displays it in the New Project win‐
dow.
Figure 6: SOPAS ET: main window
7.2 Logging into the device
1.
In the project window, click
Login to establish communication.
2. Select Autorisierter Kunde as the as user level and enter the password
client . Click the Login button.
7.3 Output of measured values via terminal program
Example commands for output of measured values
If the LiDAR sensor receives one of the two example commands by telegram
through the Ethernet interface, it will start the output of measured values through
8020471/12FY/2019-04-02/en MRS1000 | SICK 2
 Loading...