Reference Manual Chapter 2
Ranger E/D
©SICK AG • Advanced Industrial Sensors • www.sick.com • All rights reserved 13
Overview
If the Ranger was unable to locate the laser line for a point – for example due to insuffi-
cient exposure, that the laser line was hidden from view, or that the laser line appeared
outside of the ROI – the Ranger will return the value 0. This is usually referred to as miss-
ing data.
In addition to the range values, the Horizontal max, Horizontal threshold and max, and
Hi3D for Ranger E/C and ColorRanger E also deliver intensity values for the measured
points along the laser line. The intensity values are the maximum intensity in each column
of the sensor, which – in the normal case – is the intensity of the reflected laser line.
(1)
The resolution in the measurements depends on which component that is used. For
example the Horizontal max and threshold method returns the location of the laser line
with ½ pixel resolution, while the Hi3D method has a resolution of
1
/16
th
of a pixel.
Note that the Ranger delivers the measured range values as integer values, which repre-
sent the number of “sub-pixels” from the bottom or top of the ROI. For example, if the
Ranger is configured to measure with ½ pixel resolution, a measured range of 14,5 pixels
is delivered from the Ranger as the integer value 29.
Besides the measurement method, the resolution in the measurements depends on how
the Ranger and the laser are mounted, as well as the distance to the object. For more
information on how the resolution is affected by how the Ranger is mounted, see chapter
3 'Mounting Rangers and Lightings'.
The performance of the Ranger – that is, the maximum number of profiles it can deliver
each second – depends on the chosen measurement method, but also on the height of
the ROI in which to search for the profile. The more rows in the ROI, the longer it takes to
search.
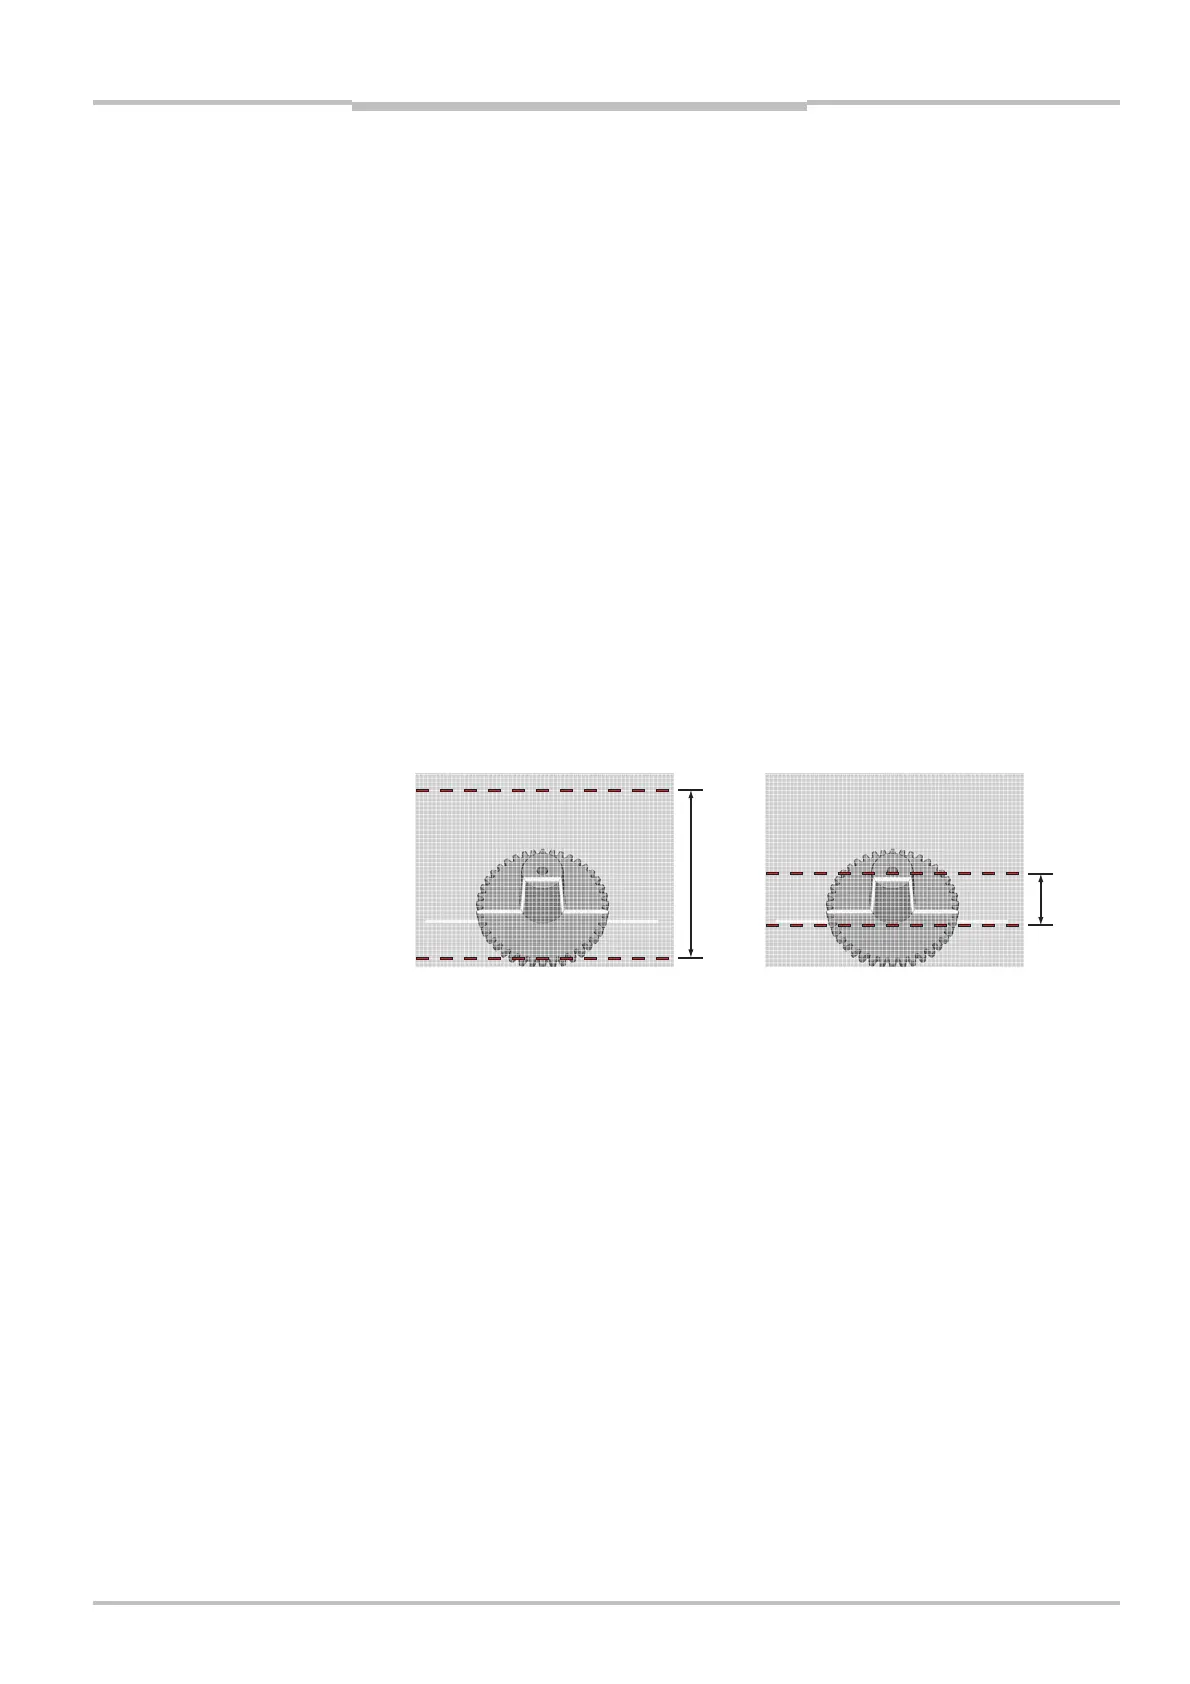
Therefore, one way of increasing the performance of the Ranger is to use a smaller ROI.
Figure 2.6 – A ROI with few rows will be faster to analyze than a ROI with many rows.
Note that the maximum usable profile rate can be limited by the characteristics of the
object’s surface and conditions in the environment.
(1)
The intensity value from Ranger C’s Hi3D component is the accumulated intensity in
each column, which in the normal case still can be used as a measurement of the intensity
of the reflected laser line.