E2 / D2 Display, functions and measuring process
Technical changes reserved - 31 -
3 Display, functions and measuring process
For inspecting, adjusting or calibrating, the digital manometer E2 / D2 must be connected to
a pressure generator and the pressure measuring equipment to be tested.
The section "Measurement process" uses examples to describe the calibration process using
a P40.2 pneumatic hand pump as a pressure generator and a mechanical manometer as the
unit under test.
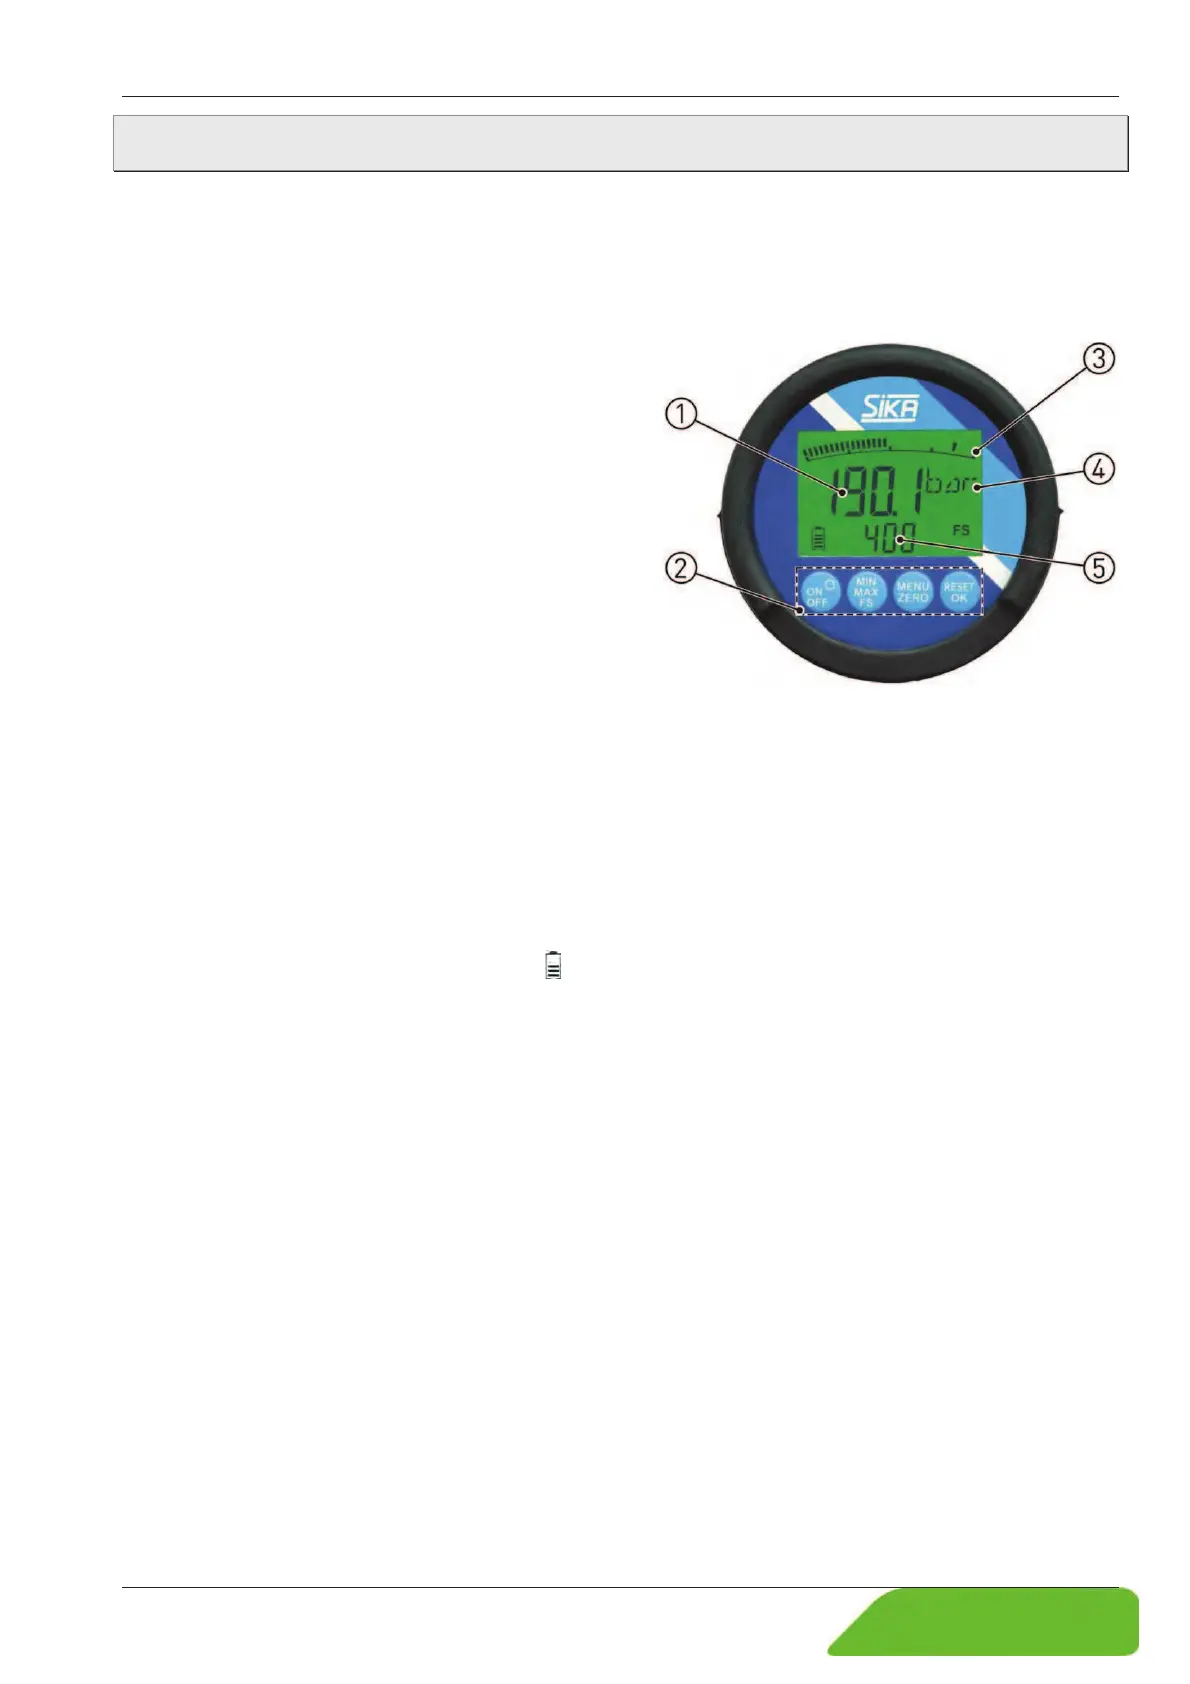
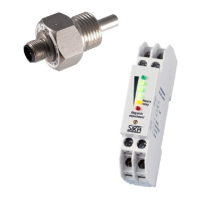
Display and control panel:
c Measured value display.
d Control panel with buttons.
e Bar graph display with drag indicator func-
tion.
f Unit display.
g Status line.
The digital pressure gauge E2 / D2 has a LCD display with additional elements and a graphic
bar graph display.
The measured values are displayed as numbers in the 4 ½ -digit display c. The selected
measurement unit f (bar, PSI, kPa, MPa, kg/cm
2
, mH2O) is displayed next to the measure-
ment value.
The bar graph display e represents the pressure range of 0 to 100% in graphic blocks. The
drag indicator function shows pressure peaks with a single line.
In the status bar g, the battery symbol
indicates the current battery level. Next to that, de-
pending on the default, the MIN-, MAX- or FS value is shown.
The measuring mode(J § 6.1) and the menu for device settings (J § 6.1.1) are operated
using the four buttons on the control panel d.
Function of the reference:
Signals from the pressure measurement cells are recorded at a sampling rate of 10 ms
(100 measurements/s), converted into pressure values and displayed. The high sampling rate
means that dynamic pressure peaks can also be measured. These are written to the
MIN/MAX memory, which is continuously updated.
The reference E2 / D2 supports daily pressure measurements with practical functions such
as MIN/MAX display, display filter, zero function, pressure unit adaptation, illumination, bat-
tery level display and a programmable Auto-Off function.