4 - 14 QuickCollect
User Manual
Viewing Graphical Measurement Results
To view measurement data plots:
Tap the generate plot button at the bottom of the home screen.
Figure 4 – 15.
Generate plot button.
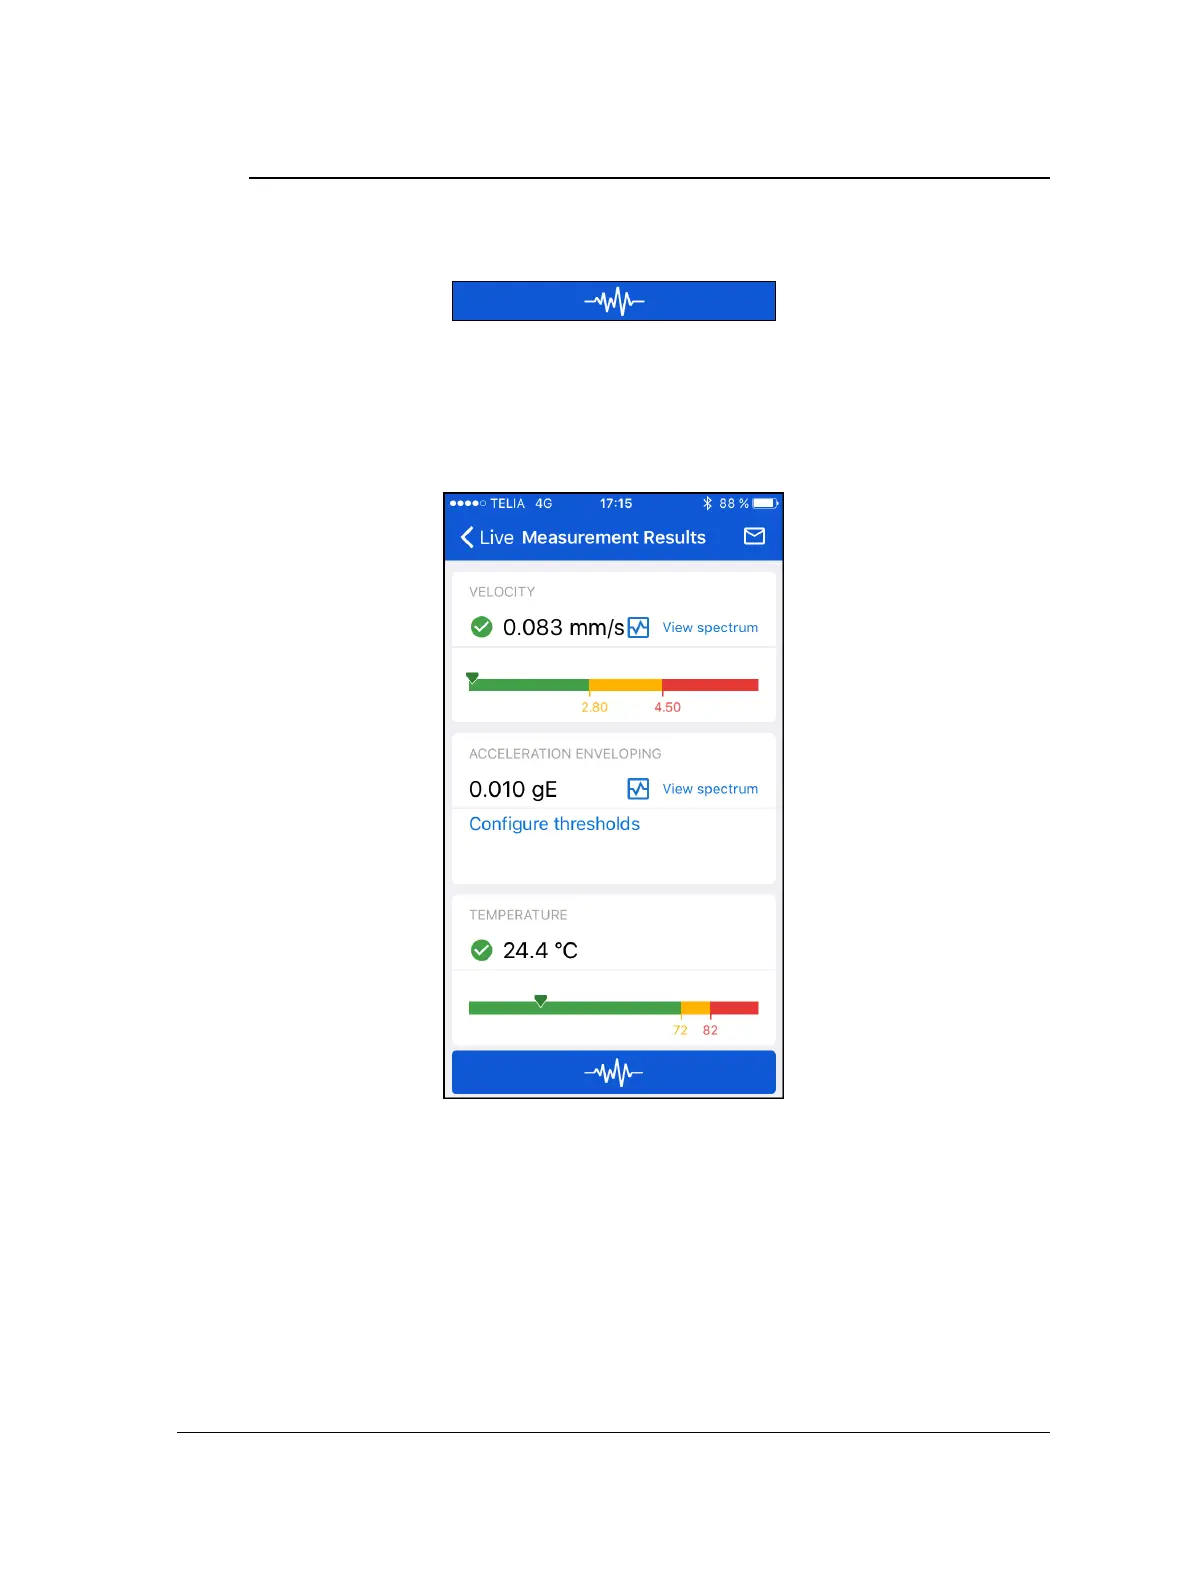
QuickCollect collects data and then processes this data to calculate velocity and
acceleration envelope. The Measurement Results screen will appear with two View
Spectrum options.
Figure 4 – 16.
Measurement results screen with view spectrum options.