Getting Started
1-8
1 Getting Started
Overview
This User Guide covers the PVA-1500 I-V Measurement Units, the SolSensors, and PVA application
software. Throughout this user’s guide when you see “PV Analyzer” or “PVA-1500” it is referring to
all 1500 Volt versions, including the PVA-1500S, PVA-1500V2, PVA-1500V3, PVA-1500V4, PVA-
1500T, and PVA-1500HE.
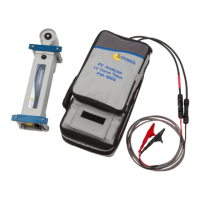
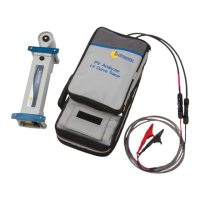
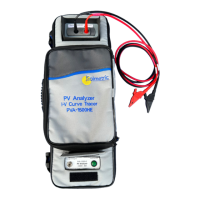
The Solmetric PV Analyzer is a portable electrical test instrument designed for commissioning and
troubleshooting PV arrays. It measures the current-voltage (I-V) curves of PV modules and strings and
immediately compares the results to the predictions of built-in PV models. Measurement results are
easily saved for future reference and analysis. The I-V Measurement Unit and associated sensor unit are
controlled wirelessly by your tablet or notebook PC. Wireless interfaces allow you to move around in
the immediate work area without the trip hazards associated with hard-wired interconnections.
Irradiance, PV module temperature, and PV module tilt are measured by SolSensor, a wireless PV
reference sensor that streams this data to your PC. Sensor measurements are also triggered
simultaneously with the I-V curve measurement and saved with the I-V curve data.
The (I-V) curve of a PV module, string, harness, or array provides a detailed description of its energy
conversion ability. The curve nominally ranges from the short circuit current (Isc) at zero volts, to the
open circuit voltage (Voc) at zero current. At the ‘knee’ of a normal I-V curve are the maximum power
current and voltage (Imp, Vmp), the point at which the array generates the maximum electrical power at
the present irradiance and temperature. All of these important voltages and currents are captured when
the I-V curve is measured. The detailed shape of the curve between these points gives additional
information about the health of the PV module, string, or array under test.
The value of the measured I-V curve is greatly increased by comparing it with the predictions of a
comprehensive PV model. The model takes into account the specifications of the PV modules, the
number of modules in series and strings in parallel, and the losses in system wiring. Other data used by
the model includes the irradiance in the plane of the array, the module temperature, and array
orientation.
The PC software that controls the PV analyzer contains a powerful graphical Array Navigator tool with
a graphical array tree that you touch to save and recall your measurement data. The New Project Wizard
guides you in setting up the PV model and customizing the array tree to your project.
The PC software can also save insulation resistance data collected by a separate insulation resistance
tester. This data is stored and managed using the same type of array tree touch interface as the I-V
measurement results.
 Loading...