Interpreting Measured I-V Curves
7-119
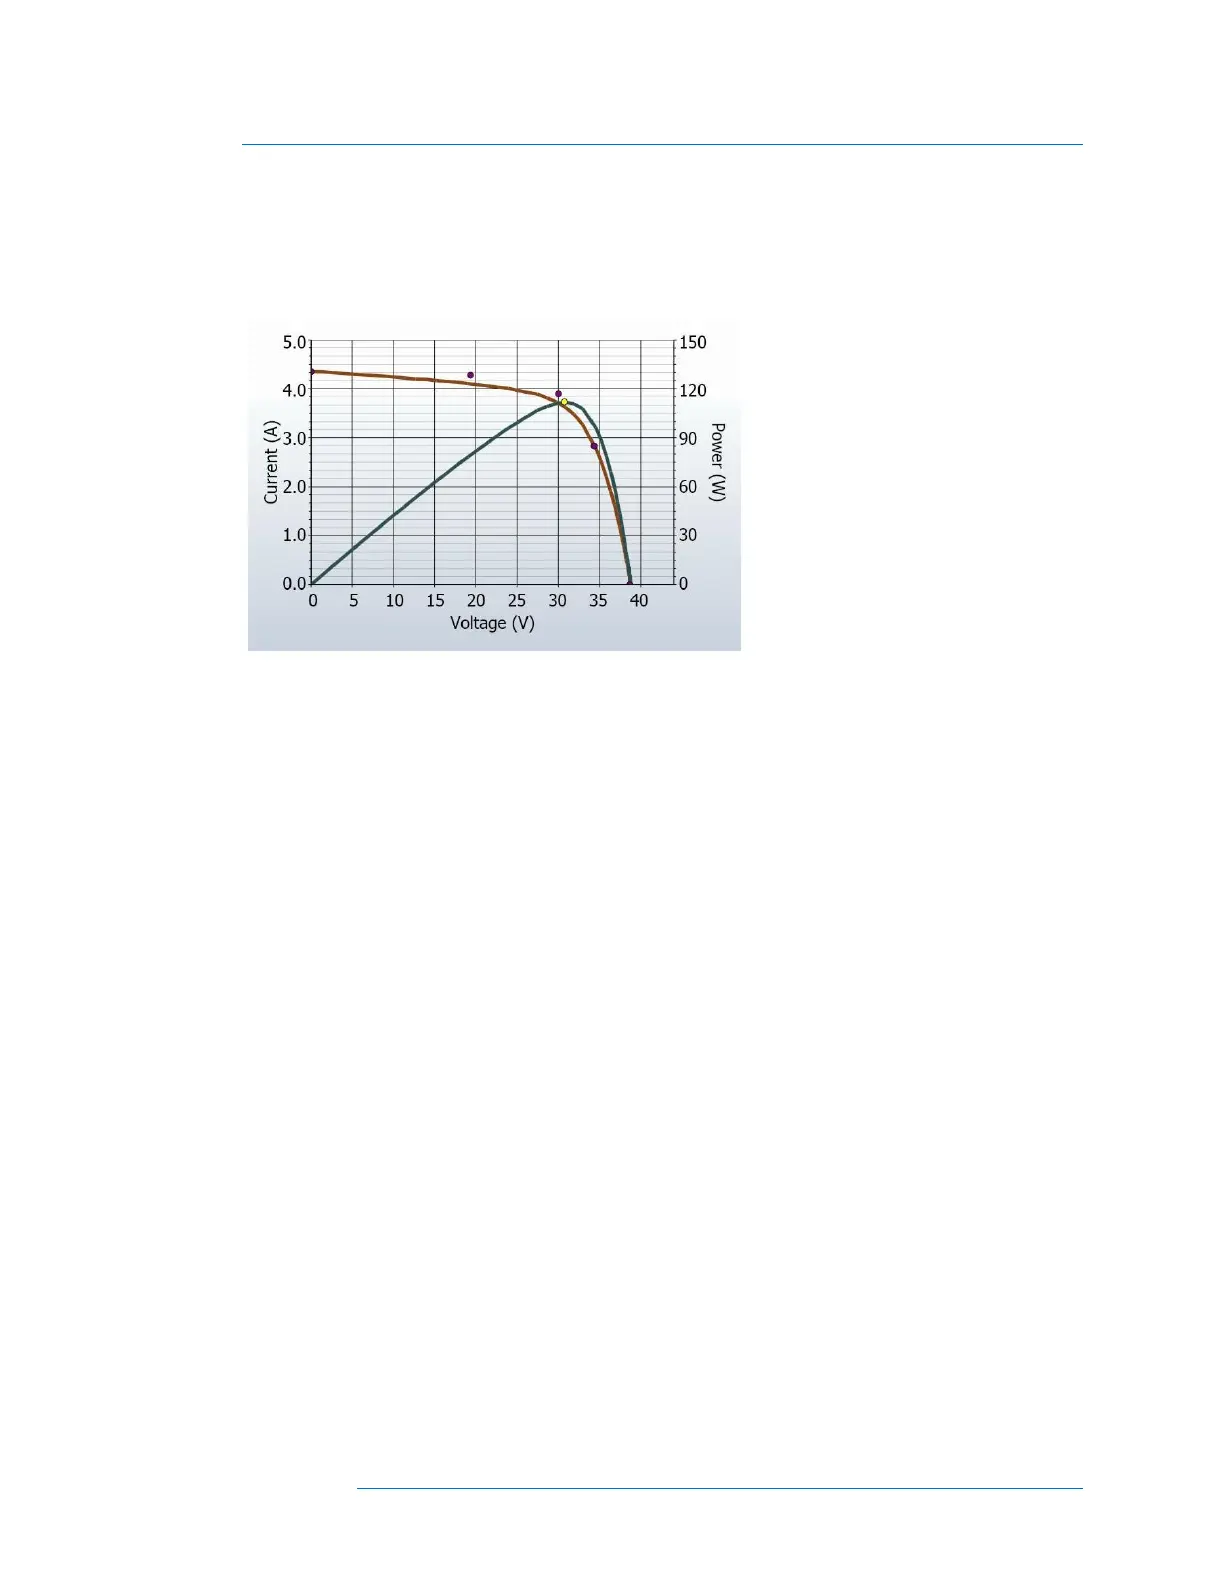
5. Steeper slope in horizontal leg
An example of this deviation is shown below.
Figure 61. An I-V curve showing steeper slope in the horizontal leg of the I-V curve.
The horizontal leg of the I-V curve may exhibit a steeper slope than the PV model predicts.
Potential causes of this deviation are summarized below, and then discussed in more detail.
• Tapered shade or dirt dams
• Module Isc mismatch
• Shunt paths exist in PV cells
Tapered shade or dirt dam across all cell groups
A tapered band of shade or dirt across the all cell groups can cause the steeper slope in the horizontal
leg of the curve.
Increased Shunting in PV Cells
Shunting is the flow of PV current backwards across the cell junction. This is a current loop internal to
the cell, which subtracts from the current that it is able to contribute to the string. Some amount of
shunt current within a solar cell is normal, and is the cause of the slight slope in the horizontal leg of the
curve. But if the shunt resistance of cells degrades to a lower value across the array, the slope of the
horizontal leg becomes steeper.
Localized shunt failures cause local heat dissipation, and can lead to runaway thermal failures of the
cell and module.
 Loading...