Interpreting Measured I-V Curves
7-117
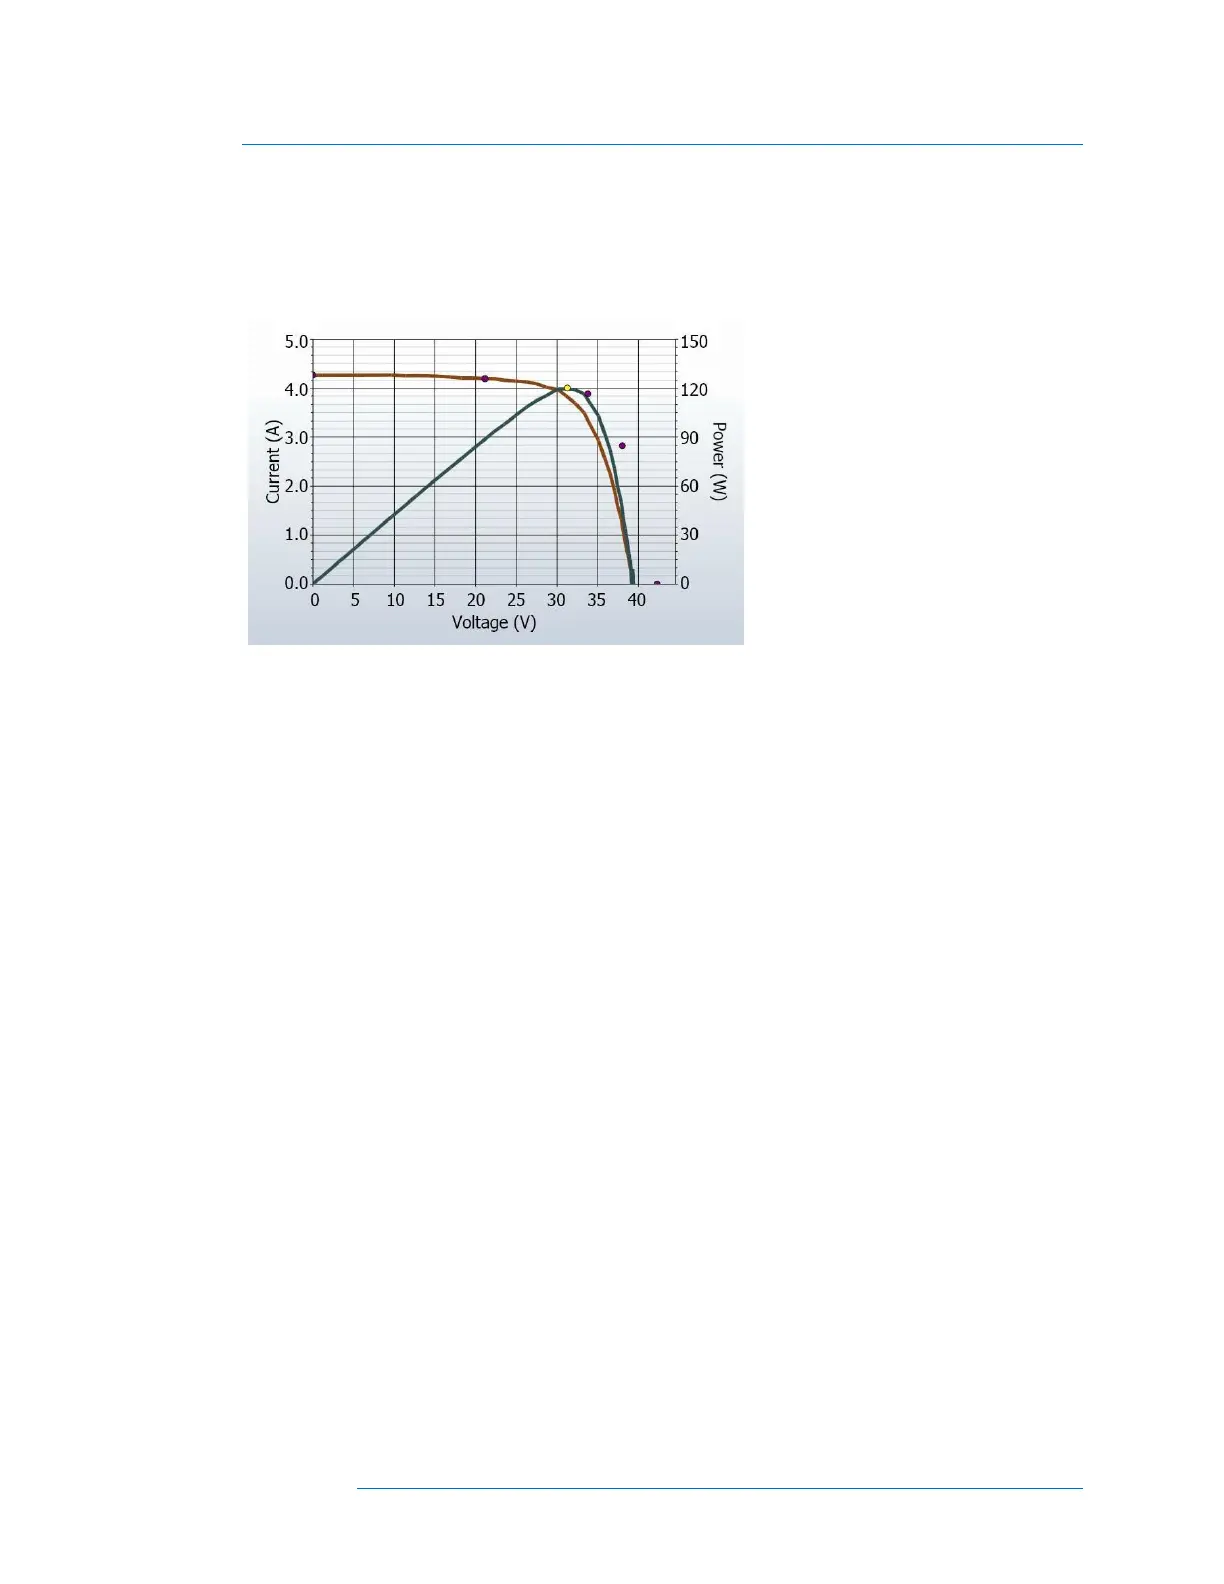
3. Low voltage
An example of this type of deviation is shown in below.
Figure 59. Measurement with less steep than predicted slope in the vertical leg of the I-V curve.
Potential causes are summarized below, and then discussed in more detail:
• Tapered shade or dirt dams extending across all cell groups
• Increase ‘shunting’ in PV cells
PV Cell Temperature Measurement Is Incorrect
The module V
oc
is dependent on the temperature of the solar cells, with higher temperatures resulting in
a lower V
oc
. It is possible that a poor thermal connection exists between the thermocouple and the back
of the module.
Also, if two thermocouples are plugged into SolSensor an only one of them is attached to the back of a
module, the PVA will average the two thermocouple temperatures.
Placement of the thermocouple is also important. It should be placed at a location that represents the
average temperature of the modules. Avoid the edges of the table/array; they run cooler because of
better air circulation.
One or More Bypass Diodes Are Shorted
This is a possible cause in single-string measurements. In parallel-string measurements it causes a step
in the I-V curve.
 Loading...