5
Sookook Corporation
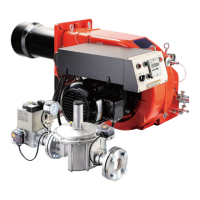
1C. Burner Performance Curve
The below chart shows the range of burner safety usage in accordance with combustion safety standards.
Depending on the burner capacity, there may be a deviation from the initial furnace pressure, and the deviation is not the same for each
boiler. Because there is no strict correlation between the initial furnace pressure and normal furnace pressure, the below chart shall be used
as a reference.
[Figure 1C-A. P3M - P60M Performance Curve (60Hz)]
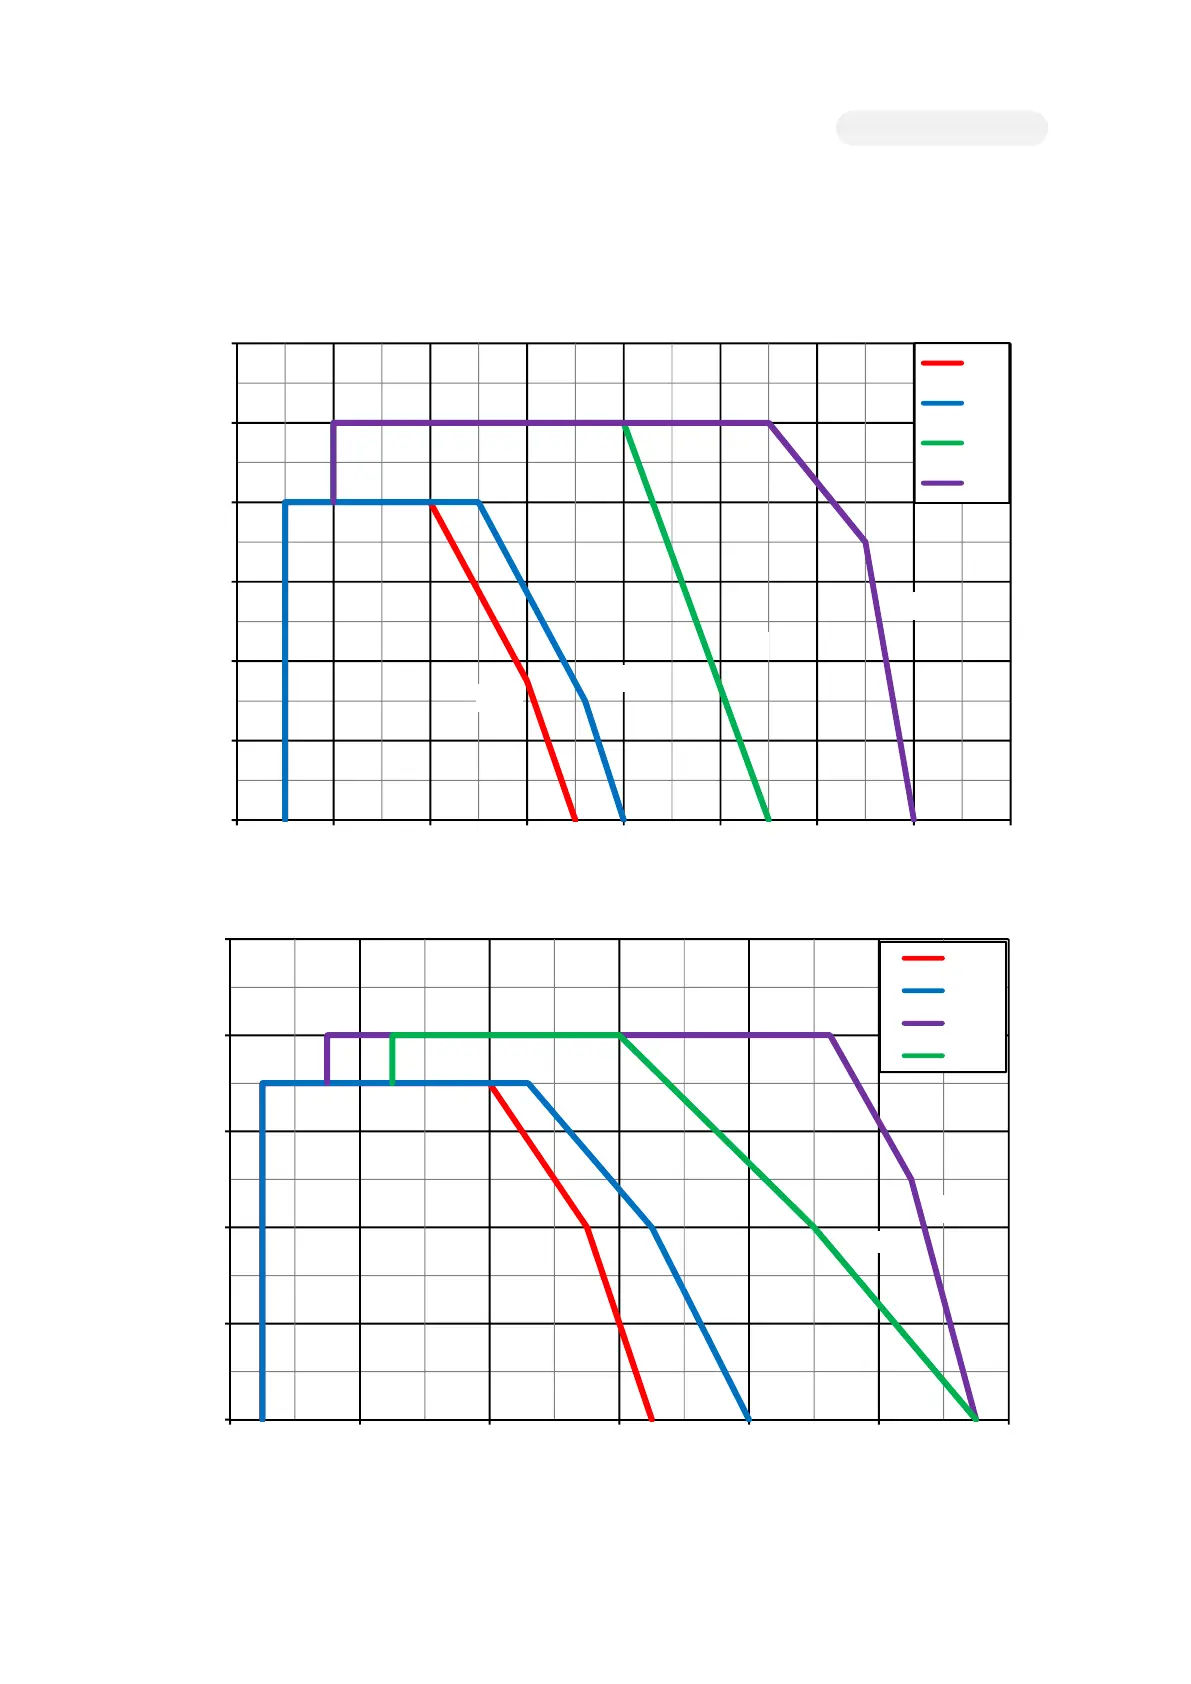
[Figure 1C-B. P7M - P92M Performance Curve (60Hz)]
0
2
4
6
8
10
12
10 20 30 40 50 60 70 80 90
Combustion Chamber Pressure [mbar]
Burner Output - 4% O2 (10,000*Kcal/h)
P3M
P4M
P5M
P60M
P3M
P4M
P5M
P60M
0
4
8
12
16
20
20 60 100 140 180 220 260
Combustion Chamber Pressure [mbar]
Burner Output - 4% O2 (*10,000 Kcal/h)
P7M
P72M
P8M
P92M
P7M
P72M
P92M
P8M