DHR/AR Series SALS Accessory Getting Started Guide Page 31
Paste the data from ImageJ into columns K and L.
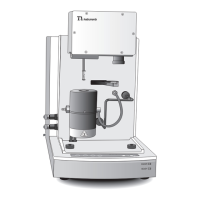
Figure 22 Data pasted.
Create a xy overlay graph of D vs. A and N vs. M. Scale the y axis to 5000 maximum.
Adjust the y shift so that the first peaks of each curve have the same maximum.
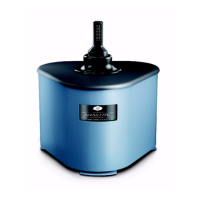
Adjust the Optics Factor so that the first peaks of each curve overlap. The quality of the overlap of the
second peak will depend on the dilution factor of the spheres solution. See the figure below.
Figure 23 Adjusting the optics factor.
In this example the y-shift is 26.5 and the Optics Factor 1.1e-3. These values can now be used to correct
sample data, as long as all the mechanical and camera settings remain unchanged, by simply pasting
ImageJ data into columns K and L.
 Loading...