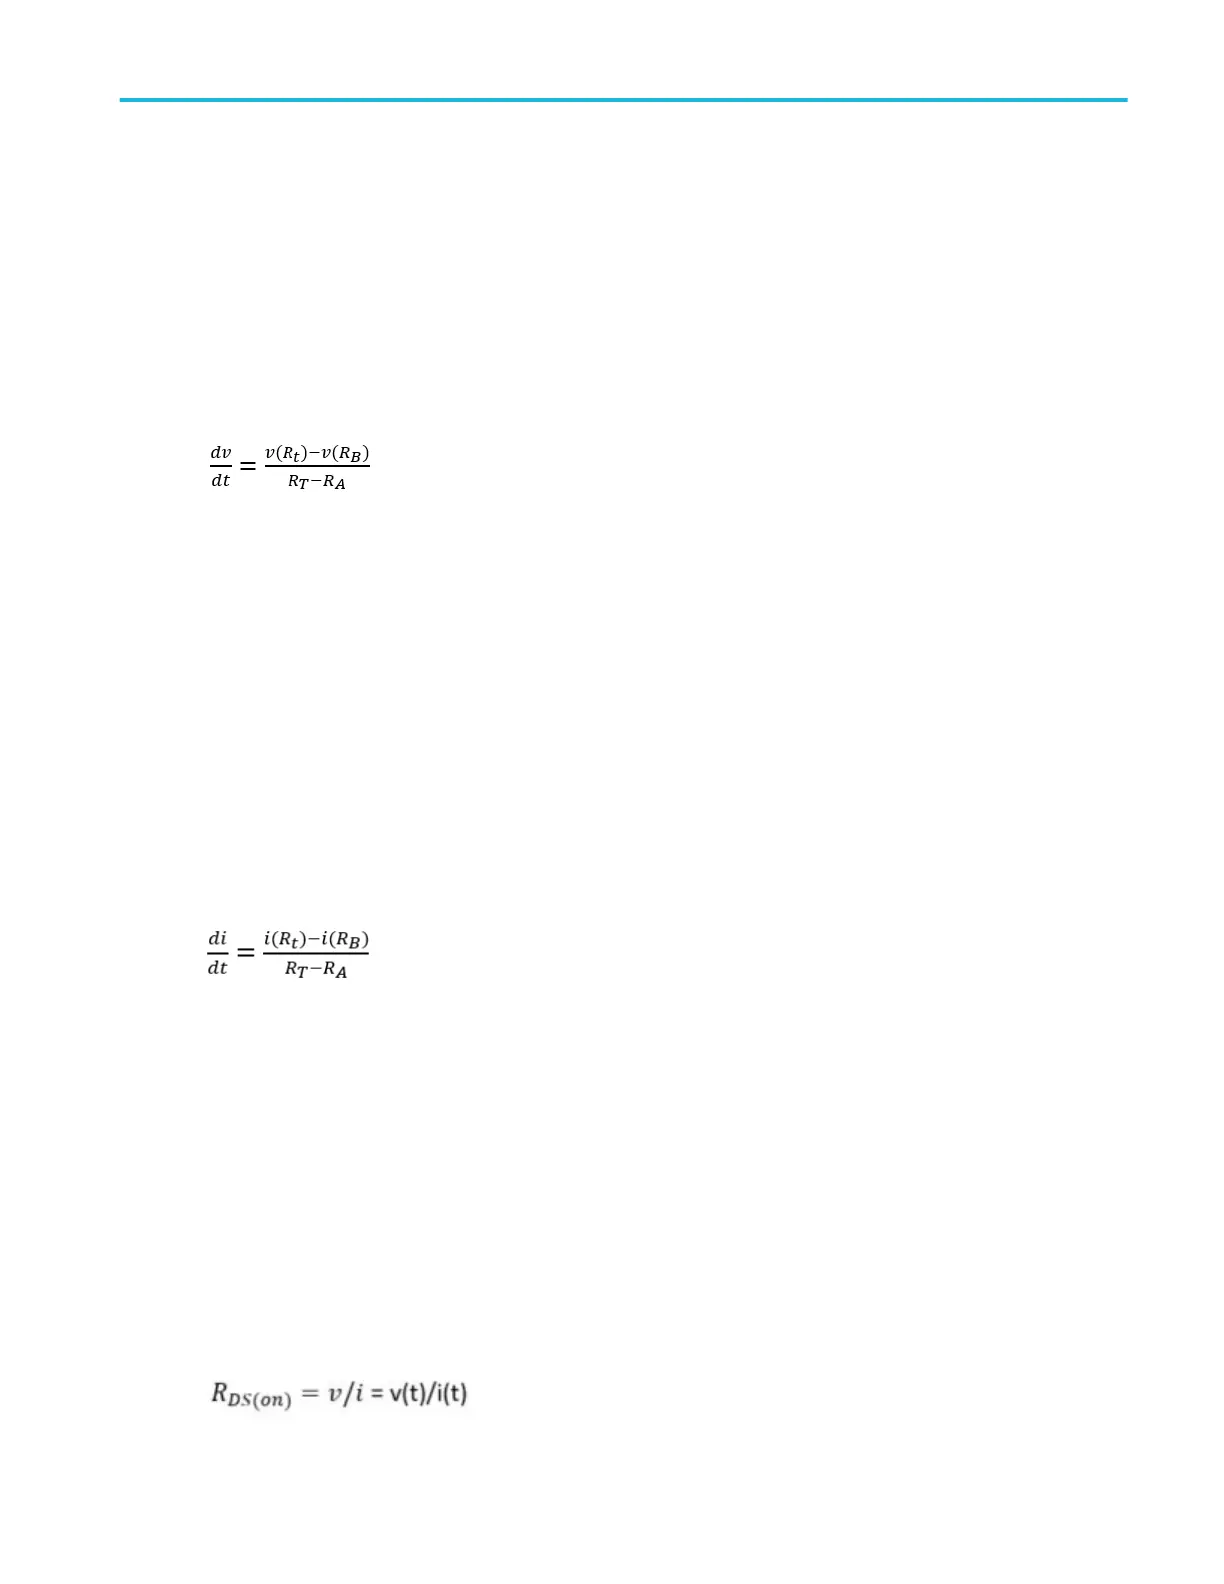
dv/dt algorithm. dv/dt represents the rate at which the voltage changes during switching. The application uses the math feature
to provide a differentiation waveform of the voltage input.
When you run the measurement, the application calculates dv/dt for the first edge by taking the default levels as 10% and 90%
and displays the results.
Select a specific section of the waveform on the live signal by providing inputs for high and low levels in terms of percentage and
absolute value of voltage and current. Select the edge of interest by viewing it visually on the oscilloscope. You can also enter
the edge number on the results panel. The application displays the results for the selected edge and levels on the results panel.
The application calculates dv/dt using the following equation:
Where:
X is the timing values.
Y is the vertical (voltage) values of the waveform data between the cursors.
di/dt algorithm. di/dt measurement represents the rate at which the current changes during switching. The application uses the
oscilloscope's built in math feature to provide a differentiation waveform of the current input.
When you run the measurement, the application calculates di/dt for the first edge by considering the default levels as 10% and
90% and displays the results.
Select a specific section of the waveform on the live signal by providing inputs for high and low levels in terms of percentage and
absolute value of voltage and current. Select the edge of interest by viewing it visually on the oscilloscope. You can also enter
the edge number on the results panel. The application displays the results for the selected edge and levels on the results panel.
The application calculates di/dt using the following equation:
Where:
I is the timing value.
t is the vertical values of the waveform data.
SOA algorithm. SOA plots the graph of the voltage and current waveform. You can configure SOA mask by creating voltage and
current co-ordinates in the mask table. You can save and recall mask files. The extension of the mask file name is .pwrmsk.
SOA has two outputs:
1. SOA X-Y plot with mask showing hits on the mask.
2. SOA summary on the measurement badge displays the number of hits with Pass/Fail status.
R
DS(on)
algorithm. Dynamic resistance (R
DS(on)
) is the resistance offered by a switching device when it is in the ON condition.
Power helps to monitor the dynamic resistance using a Time Trend plot. You can calculate R
DS(on)
by using the below formula:
where, v/i is the ratio of voltage to current sample points. It is applicable for switching semiconductors.
Measurement algorithms
MSO54, MSO56, MSO58, MSO58LP, MSO64 Help 471
 Loading...