Telewave, Inc.
Model 44A/AP
Page 17
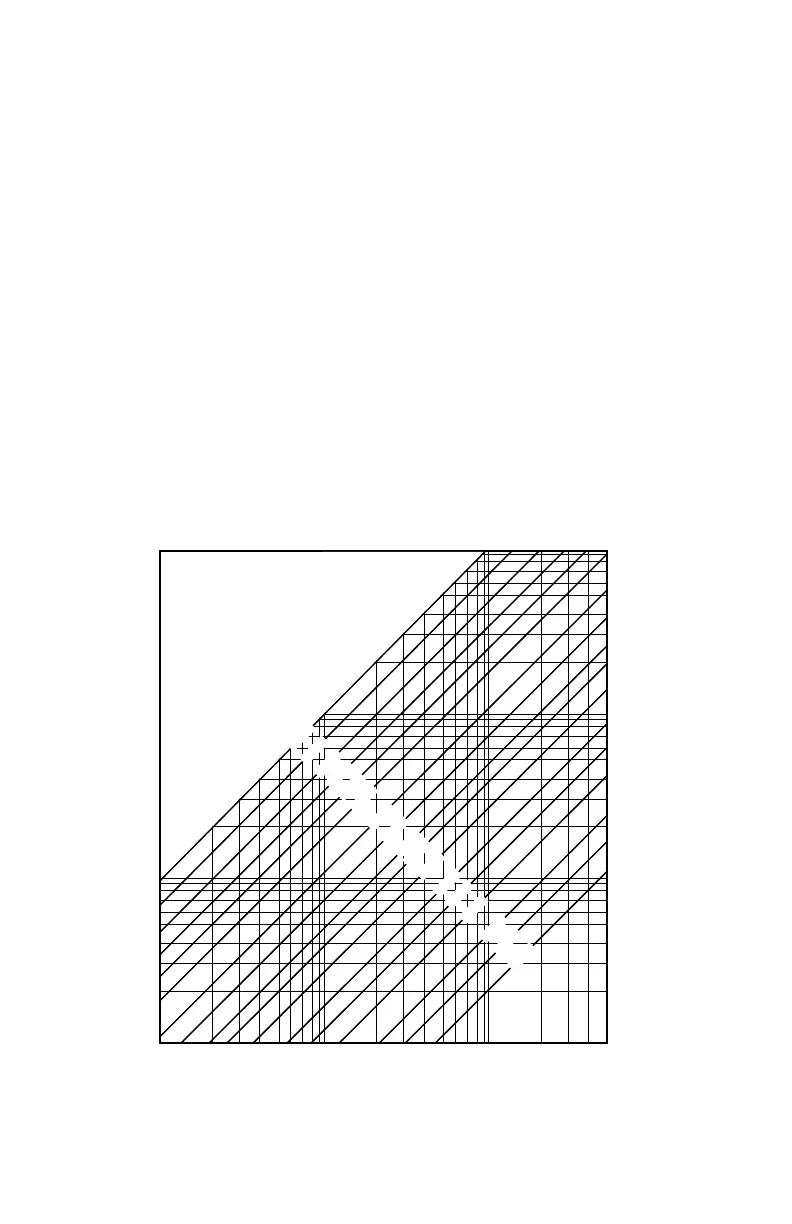
Figure 7-1: VSWR Chart
FORWARD POWER - WATTS (P
FWD
)
R
E
F
L
E
C
T
E
D
P
O
W
E
R
W
A
T
T
S
(P
REV
)
10.00
5.00
4.00
3.00
2.50
2.00
1.75
1.60
1.50
1.40
1.30
1.25
1.20
1.15
1.12
1.10
100
50
20
10
5
2
1
0.5
0.2
0.1
500200100502010521
VSWR
CHART
8
7.0 REFERENCE
7.01 Part 7 contains additional data for the Model 44A/AP RF Watt-
meter which is helpful in making low frequency and VSWR mea-
surements.
7.02 Figure 7-1 (below) shows a nomograph for estimating VSWR
from the measured incident and refl ected power. See 5.05 for cal-
culation procedures.
7.03 Figure 7-2 (pg. 18) shows the watt meter correction factor for
power measurements below 150 MHz. For example:
Frequency = 43 MHz
Indicated Power = 275 Watts
Correction Factor for 43 MHz = +12%
275 x 1.12 = 308 Watts (+/- 6%)