34 Using the Scratchpad
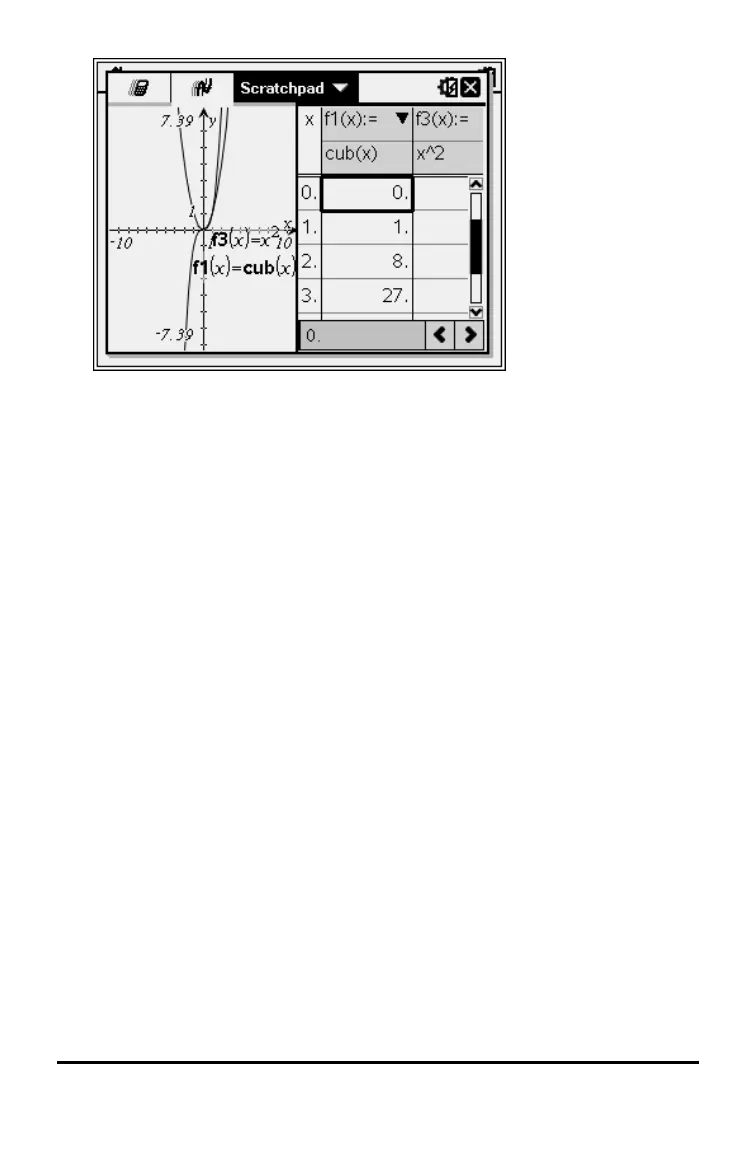
▶ To hide the table, click the graph side of the split screen and then press
b > Table > Remove Table (b 7 2). You can also press Ctrl + T.
▶ To resize columns, click the table and press b > Actions > Resize
(b 1 1).
▶ To delete a column, edit an expression, or edit table settings, click the table
and press b > Table (b2).
Changing the Appearance of the Axes
As you work with graphs, the Cartesian axes are displayed by default. You can
change the appearance of the axes in the following ways:
1. Press b 4 and choose the Zoom tool to use.
2. Select the axes and press / b 2 to activate the Attributes tool.
a) Press £or¤ to move to the attribute to change. For example, choose
the end style attribute.
b) Press ¡or¢ to choose the style to apply.
c) Change any other attributes of the axes as required for your work,
then press · to exit the attributes tool.
3. Adjust the axes scale and tick mark spacing manually.
a) Click and hold one tick mark, then move it on the axis. The spacing
and number of tic marks increases (or decreases) on both axes.
b) To adjust the scale and tick mark spacing on a single axis, press and
hold g and then grab and drag a tic mark on that axis.
4. Change axis end values by double-clicking them and typing new values.

 Loading...


