www.ti.com
Functional Description and Operation
13
SPRUI94–January 2017
Submit Documentation Feedback
Copyright © 2017, Texas Instruments Incorporated
XDS110 Debug Probe
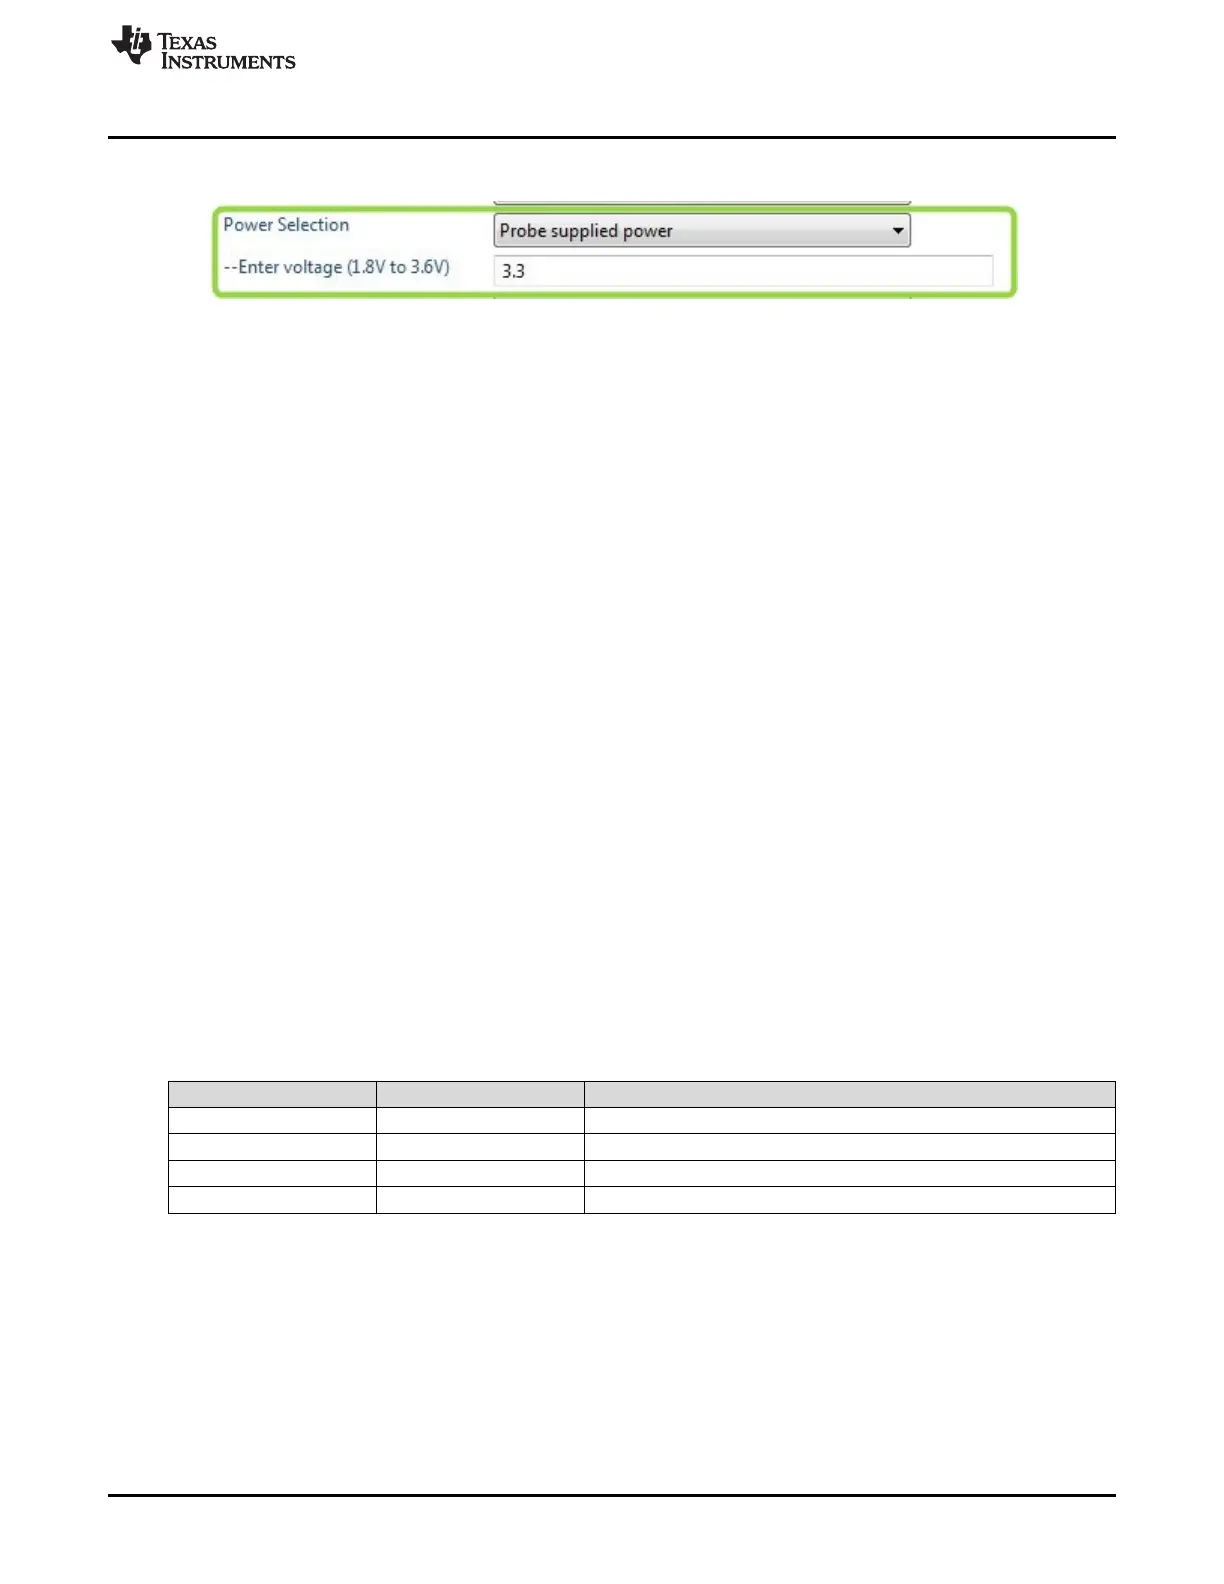
Figure 5. Probe-Supplied Power and Voltage Level
The power supply to the target is turned on when a debug or EnergyTrace session is started, and turned
off when the session terminates.
3.2 Auxiliary Target Control
There are additional interfaces between the probe and target that are mapped to GPIO signals on both the
CTI-20 and AUX cable. A typical use case for these signals is to drive GPIO inputs to the target to control
boot modes. Currently, the state of these signals can be set through the dbgjtag utility (see
Section 3.7.3.3).
3.3 SWO Trace Capture
The XDS110 probe supports ARM
®
SWO (serial wire output) trace for TI’s single-core MCU and WCS
devices. SWO trace is a single-pin trace interface that can be used for profiling hardware events such as
program counter, data reads/writes, and interrupt entry and exit, as well as application-initiated software
messages. When the XDS110 probe is supporting debug communication through 2-pin protocols such as
ARM SWD (2-pins) or 2-pin cJTAG, the target may reuse the TDO pin for SWO trace output. Currently,
only UART format is supported for transport of SWO data from target to host.
For more details on how to use SWO trace in Code Composer Studio and the devices supported, refer the
documentation at the following link: http://processors.wiki.ti.com/index.php/SWO_Trace.
3.4 ETB Trace Support
The XDS110 probe supports exporting trace data stored in on-chip buffers called ETB (embedded trace
buffer). The trace data captured in the ETB is device or trace component-specific. For more details on
using the ETB, refer the documentation at the following link:
http://www.ti.com/lit/ug/spruhm7b/spruhm7b.pdf
3.5 LED Operation
The XDS110 probe supports two LEDs to provide feedback on the operating state to the user. Table 3
maps LED functionality to probe operational states.
Table 3. LEDs and Probe Operational States
Green LED Red LED Probe Status
Off Off Probe is not powered, booting, or in Flashing mode
On Off Probe is operating normally but no active debug connection
On On Probe is operating normally and there is an active debug connection
On Rapid Flash Debug transactions are being processed
3.6 Energy Trace
3.6.1 Introduction
The XDS110 debug probe has on-board circuitry that can be used for measuring the target’s energy
consumption. The hardware circuitry provides high-accuracy energy consumption with low bandwidth
current and power profile. The energy profiling range covers 1-µA to 100-mA current draw, above which
the tool will display an overcurrent message and shutdown. This tool is ideal for characterizing energy
consumption, but not for capturing short current spikes, because sampling occurs over large time windows
(~500 µsec).