15
12. EXAMPLES OF USING THE SOWING CHART
General
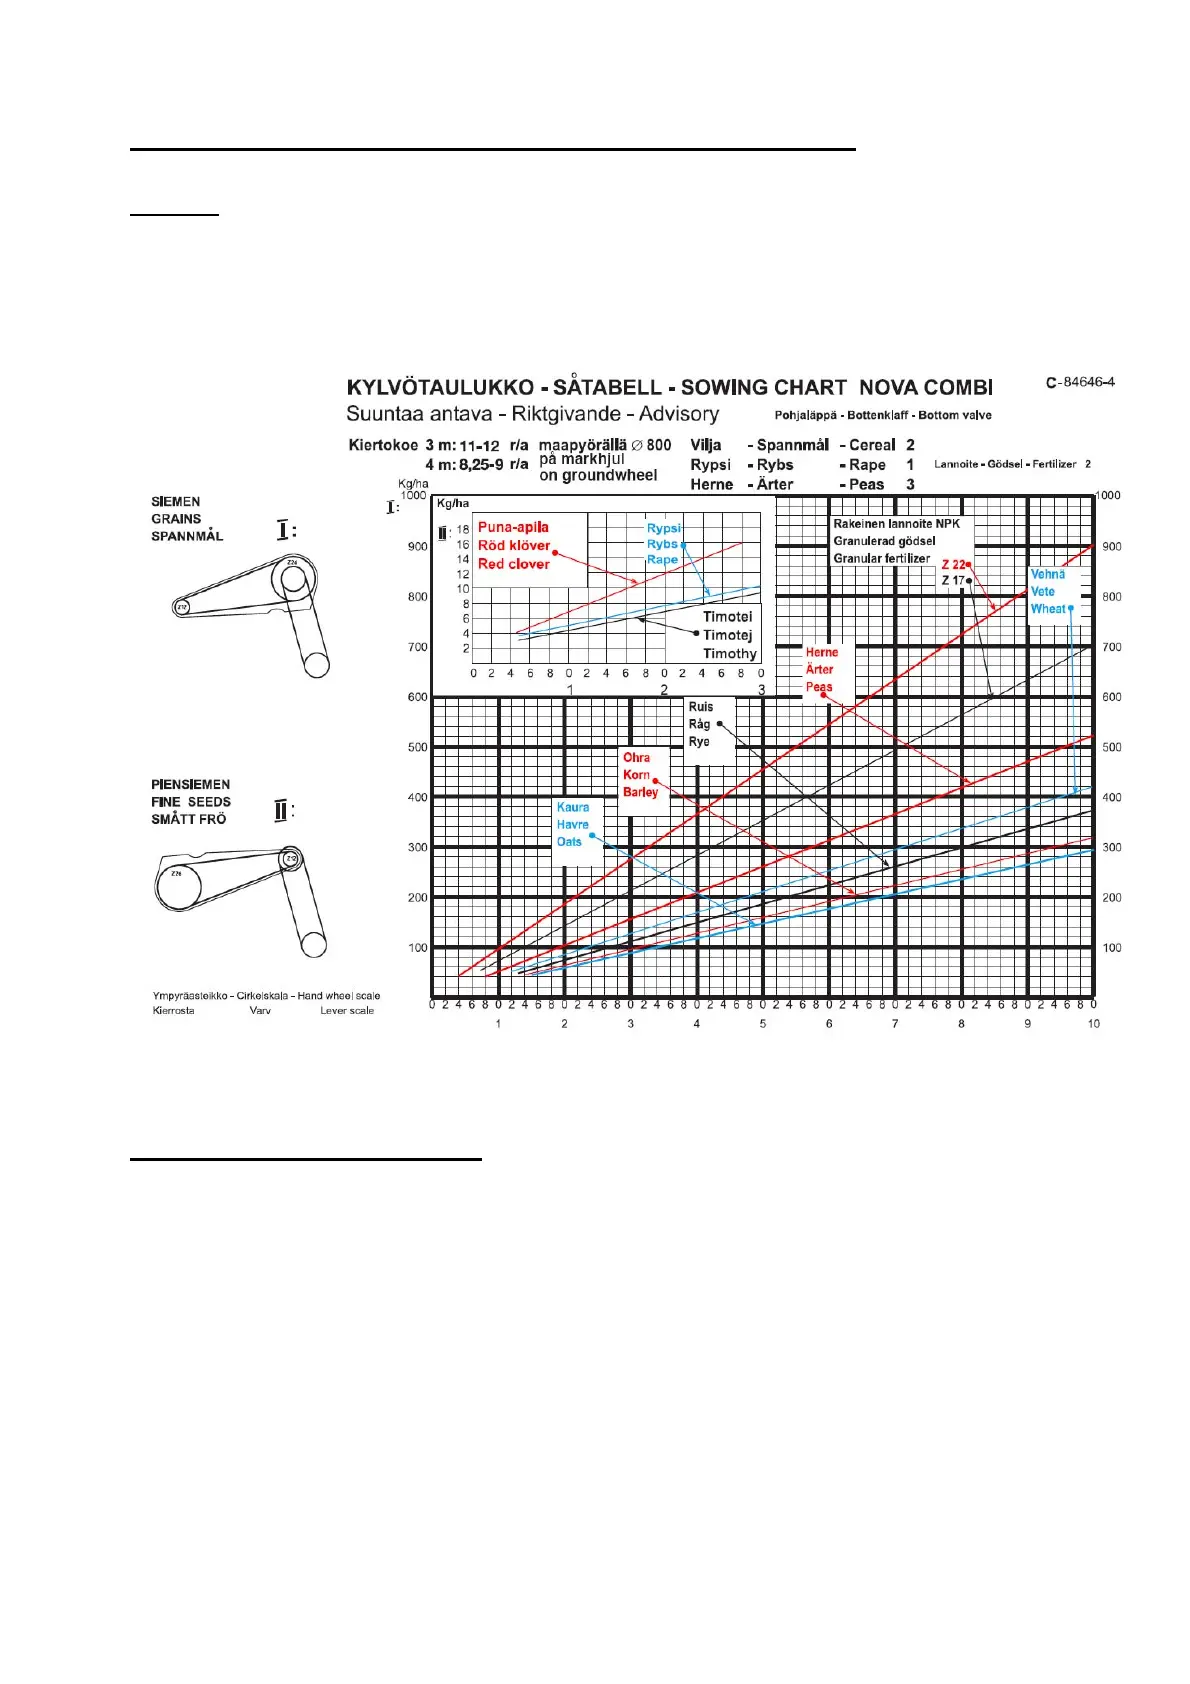
The seeding table below features three different usage examples. Note, that the dosages shown on the table
are only advisory. The actual dosage depends on the seeds in question; seed properties vary considerably
between different species and years.
To define the correct dosage, perform a calibration test, which is explained further below.
FIGURE 13. Seeding table
Adjustment example for grains
Case 1. You want to seed 200 kg/ha of oats.
• Check the correct bottom valve position in the upper right corner of the seeding table, under
"grain". The correct adjustment is "2"
• Select the graph "oats"
• Check that the machine transmission is set to "1"
• Start from the edge of table, at 200 kg/ha
• Proceed along the horizontal line to where this line intersects the graph "oats"
• Proceed straight down from this intersection to the scale which shows that the correct
adjustment is "6.8"
This means that the hand wheel should be opened by 6 full turns plus 0.8 turns. The handwheel is locked to
slot 8.



 To Next Page