UT3200 Series User Manual
16
Figure 4-1-2
Different font: +/- function button to switch font size. When press function button, 8 channels
of data will be added or decreased on the screen accordingly. Users can switch font size
depend on their own needs.
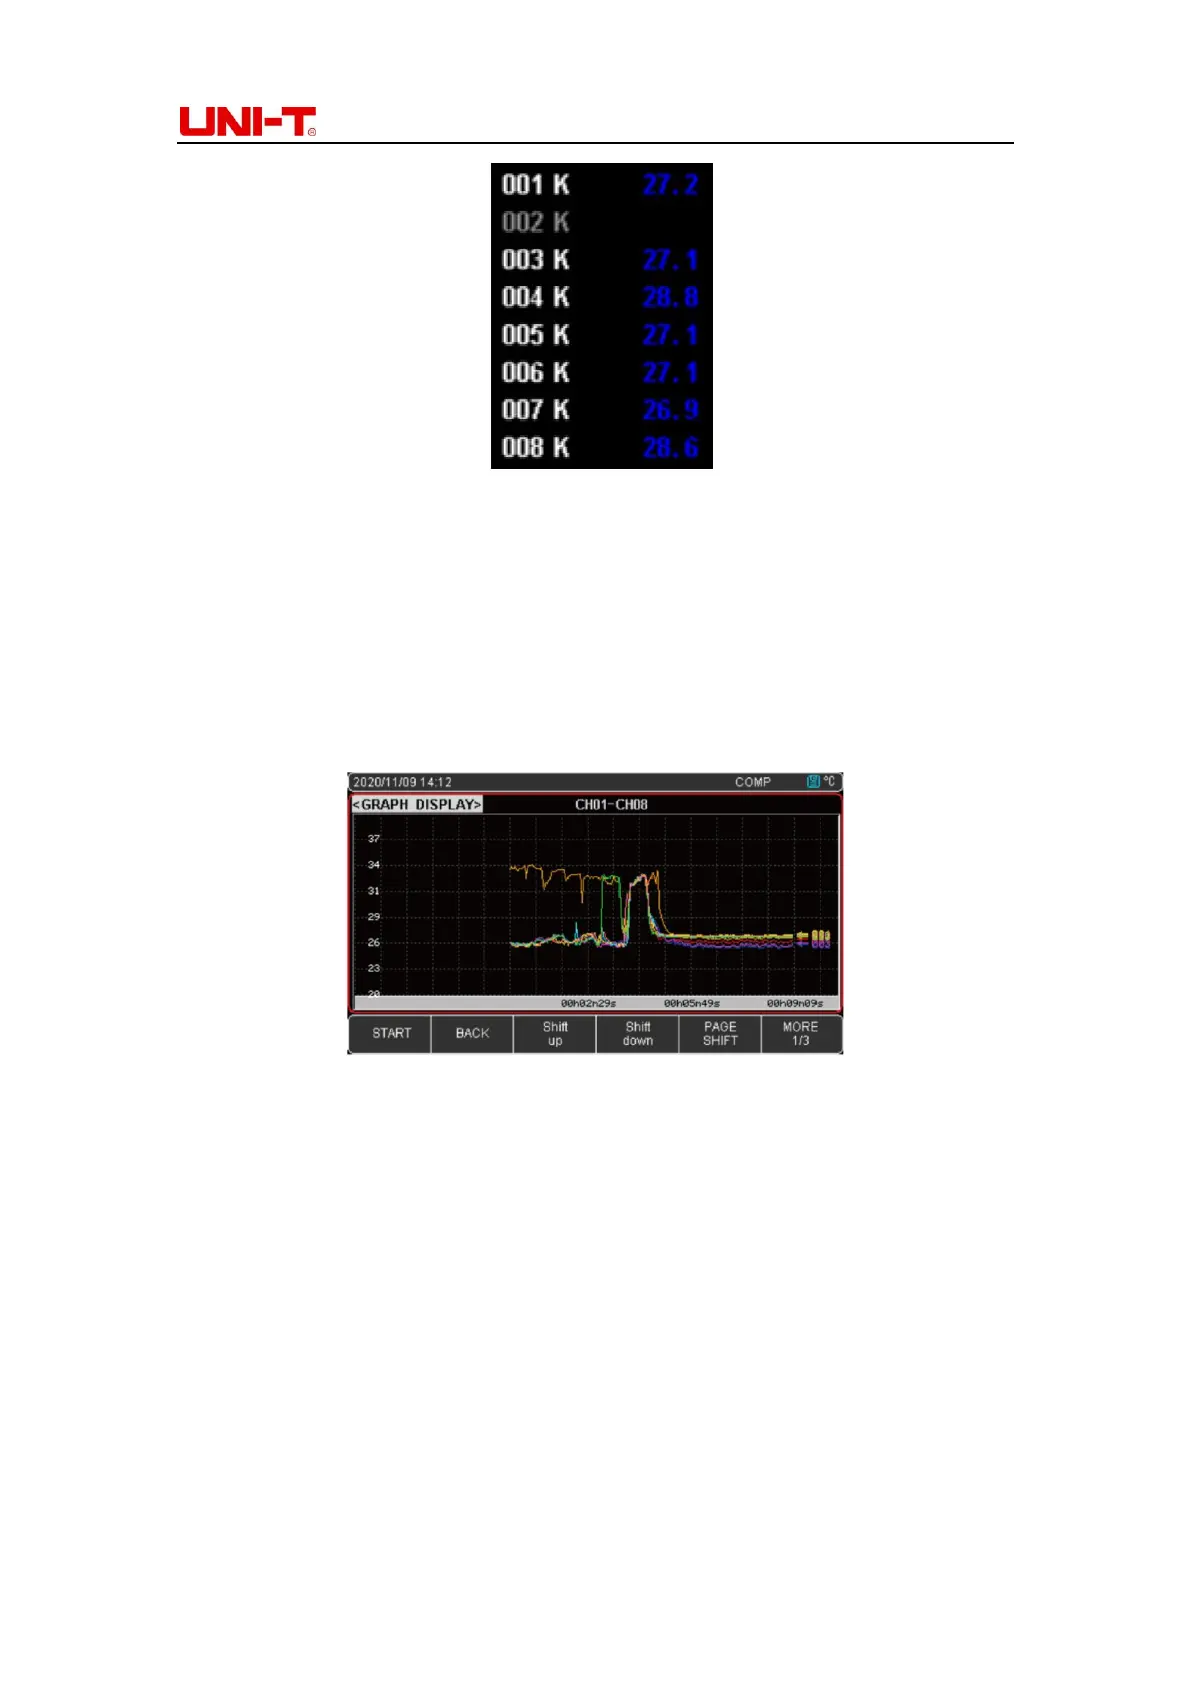
4.2 Curve figure
Curve figure is the direct way to read temperature trends. Refer to Figure 4-2-1
Figure 4-2-1
Figure 4-2-1 is an example of the temperature change with different time of Channel CH01-
CH08. The horizontal axis represents time and the vertical axis represents temperature. The
vertical axis range is based on the set of high and low temperature. You can evaluate object
temperature before test to narrow the range of vertical axis graph.
4.2.1 Curve figure the high and lower limit set up
1. Press Setup button to enter Function page
2. Use the cursor key to the high or lower limit, use the numeric keypad to enter the high
and lower limit values and press OK button to confirm. When the temperature display unit
is ℃, the initial default lower to high limit of the instrument is -200℃ and 1800℃. If the
temperature of the object is between 20℃-40℃, the lower limit can be set as 20℃ and
the upper limit as 40℃
 Loading...