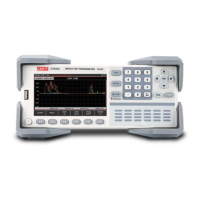
UT3200 Series User Manual
17
3. The horizontal axis equal to the time axis, the range can be set between 500ms-2mins.
This function is related to the speed. Slow speed and fast speed correspond to different
time ratios.
The horizontal axis equal to the time axis
The horizontal axis equal to the time axis
The horizontal axis equal to the time axis
The horizontal axis equal to the time axis
The horizontal axis equal to the time axis
The horizontal axis equal to the time axis
The horizontal axis equal to the time axis
The horizontal axis equal to the time axis
The horizontal axis equal to the time axis
4. Press Test button, then press Function button to enter curve figure page. Press Start,
Instrument will start to collect data and record the curve of temperature change.
4.2.2 Curve figure set up
Return to test value page
The curve goes up in parallel
The curve goes down in parallel
The original page is display 8 channel, use
Switch button to enter other channel
page
To read the curve of the next time point
X axis shift to the right
To read the curve of the last time point
Zoom in the curve of temperature range
Zoom out the curve of temperature range
X axis will not update, automatically, use
Trace enter to refresh data
Restore the initial Settings.

 Loading...