UT3200 Series User Manual
18
4.3 Histogram figure
Histogram figure is used to read the temperature of the same group of data or you can set
specific channel temperature to read the current value. The following is a detailed introduction
of the two display methods:
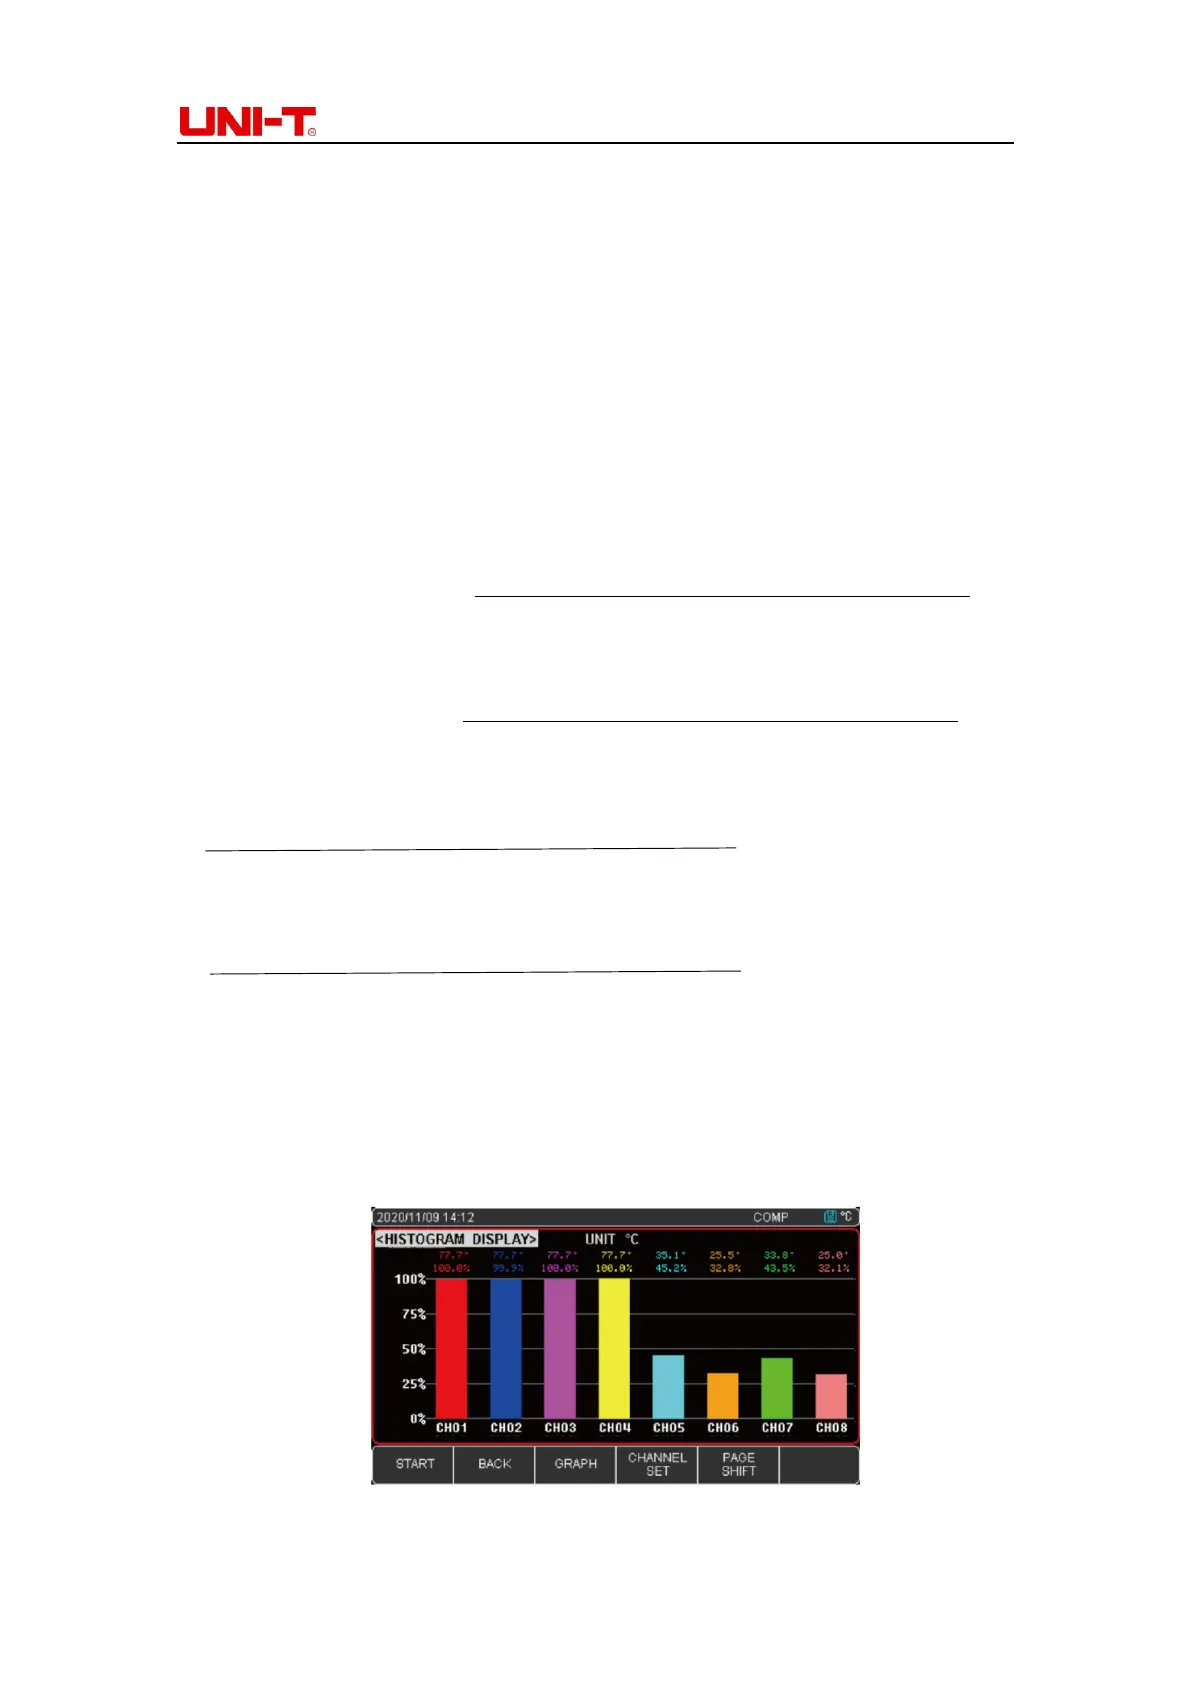
4.3.1 Automatic mode
Automatic mode is the comparison of temperature values of 8 channels on the same set of
test modules. Instrument factory default set is automatic mode.
▪ 8 channel values ≥0℃ ;
Percentage of each channel the measure temperature value
the maximum value of the same set of test modules
▪ 8 channel values ≤0℃ ;
Percentage of each channel the measure temperature value
the absolute value of the same set of test modules
▪ 8 channel values of positive percentage =
the measure temperature value
the maximum value of the same set of test modules
▪ 8 channel values of negative percentage =
the measure temperature value
the absolute value of the same set of test modules
Set up
1. Press Setup to enter Function page
2. Move the cursor key to the histogram figure, press Function to enter Automatic mode
3. Press Test to choose histogram figure. Press Start button to collect data and record the
histogram change of temperature
Figure 4-3-1A CH01-08 Histogram figure (Temperature value>0)
 Loading...