3-21
IM 04L51B01-01EN
Using Network Functions (Ethernet interface)
3
Trend
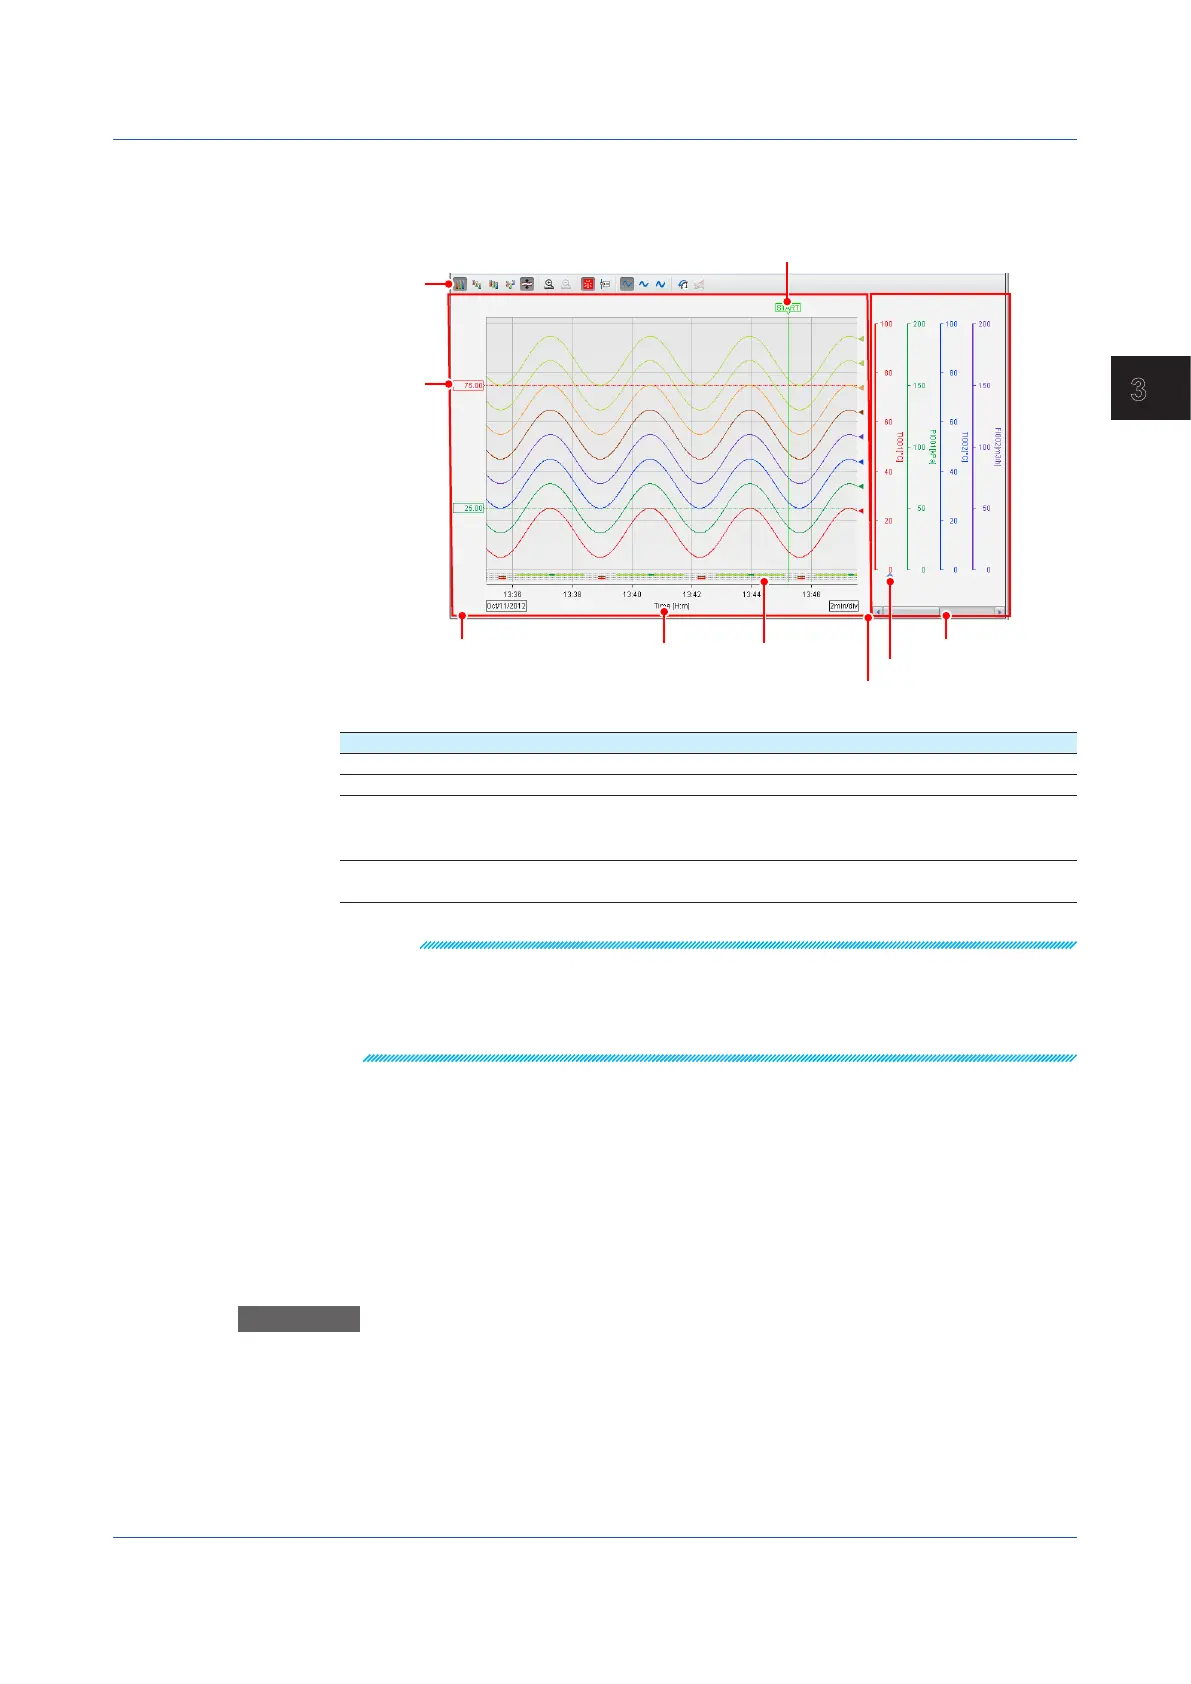
The description of a trend screen that can be displayed in one of the divided areas is given
below.
Waveform display area
Alarm displayTime axis
Splitter
Y-axis display area
Trip line
Toolbar
Active Y-axis mark
Name Description
Toolbar Change the trend waveform display mode.
Waveform display area Display channel data as waveforms.
Y-axis display area Displays the Y-axis of each channel. Each Y-axis displays a scale
image, channel name, and unit. Alarm point marks and color scale
bands are also displayed.
Splitter Drag the splitter to adjust the sizes of the waveform display area
and Y-axis display area.
Note
• The time axis displays the time of day. It does not display the elapsed time from the start of
recording.
• Partial expanded display is not possible.
• If a change is made on the GX/GP that disrupts the continuity of the data, the trend will be
cleared.
ChangingtheTrend’sActiveY-Axis
This procedure applies to the trend display.
WhatIstheActiveY-axis?
The active Y-axis refers to the Y-axis that has focus among the multiple waveforms. The
waveform display area shows horizontal grid lines that correspond to the active Y-axis.
*
The
corresponding waveform is also shown in front.
* If auto zone or free zone is in use (see the next page), the horizontal grid lines of the Y-axes that
are in the same column as the active Y-axis are also shown.
Procedure
In the Y-axis area, click a Y-axis to activate it. The active waveform icon appears below the
new active Y-axis.
3.1 Using the Web Application to Change the GX/GP Settings, Monitor Data, and Control the GX/GP (Web server function)
 Loading...