3-22
IM 04L51B01-01EN
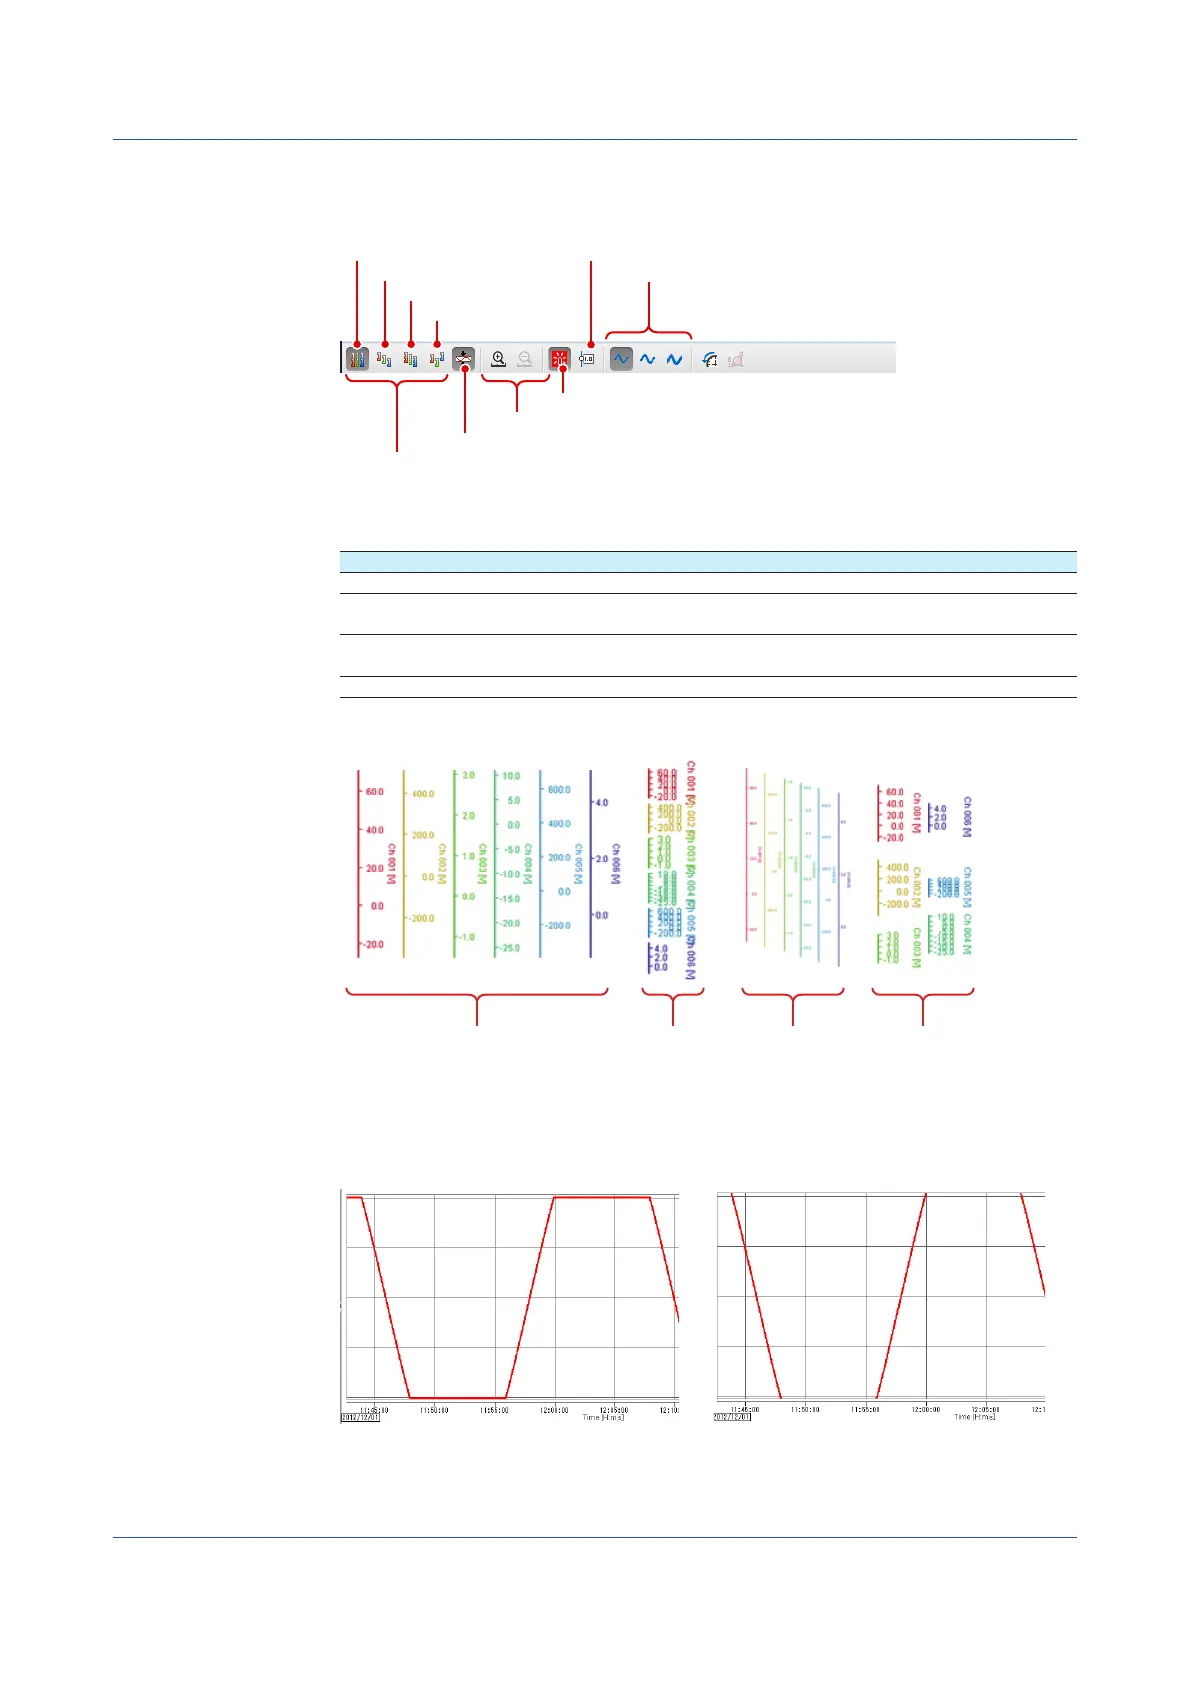
Changing the Trend’s Waveform Display
This procedure applies to the trend display. You can click the icons in the figure below to
change the waveform display.
Waveform display zone
Full
Waveform display limits
Turns the alarm display on and off
Turns the cursor display on and off
Auto
Slide
Free
Zoom in on or out of the time axis
Waveform line thickness
Waveform Display Zone
Change the waveform display zone.
Name Description
Full Displays all waveforms in full zones.
Auto Divides the waveform display area into equally spaced zones in accordance
with the number of displayed waveforms and displays the waveforms.
Slide Displays each waveform cascaded from the top to the bottom of the waveform
display area.
Free Displays waveforms in zones specified on the GX/GP.
The following figure shows the Y-axes of each display zone.
Full zone Auto zone Slide zone Free zone
Waveform Display Limits
If you apply the waveform display limit, the Y-axis display range is limited to the minimum
and maximum values of the scale. Values that are less than the minimum scale value are set
to the minimum value, and values that are greater than the maximum scale value are set to
the maximum value.
With waveform display limits
No waveform display limits
Zooming In on or Out of the Time Axis
You can zoom in on or out of the time axis.
3.1 Using the Web Application to Change the GX/GP Settings, Monitor Data, and Control the GX/GP (Web server function)
 Loading...