8
System description
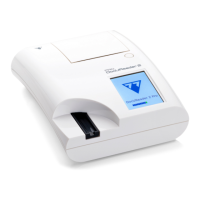
Fig. 1: Measurement principle
Each LED (1) emits light of a predefined wavelength onto the surface of the test
pad (2) from directly above the test zone. The test zone is a 3-mm circle in the
center of each pad where the test reaction is optimal.
The light from the LEDs is reflected back from the test zone with more or less
intensity. The intensity of the reflection is directly related to the concentration of
the particular analyte in the urine that the pad absorbed. Photodiode detectors (3)
positioned at optimum angles pick up the reflected light. The analogue electrical
signals from the detectors are first boosted by an amplifier (4) before they arrive at
the microcontroller (5). Here, the A/D converter in the microcontroller changes the
analogue signals into digital values. The microcontroller converts this digital data
into an absolute reflectance value by comparing it to a calibration standard. Finally,
the system calculates an evaluation value from the reflectance values, compares it
to the predefined range limits and produces a semi-quantitative result (6).
A lead (incubation) time of about 55-65 seconds between the test strips coming
into contact with the urine and the start of the measurement produce the most
accurate results.
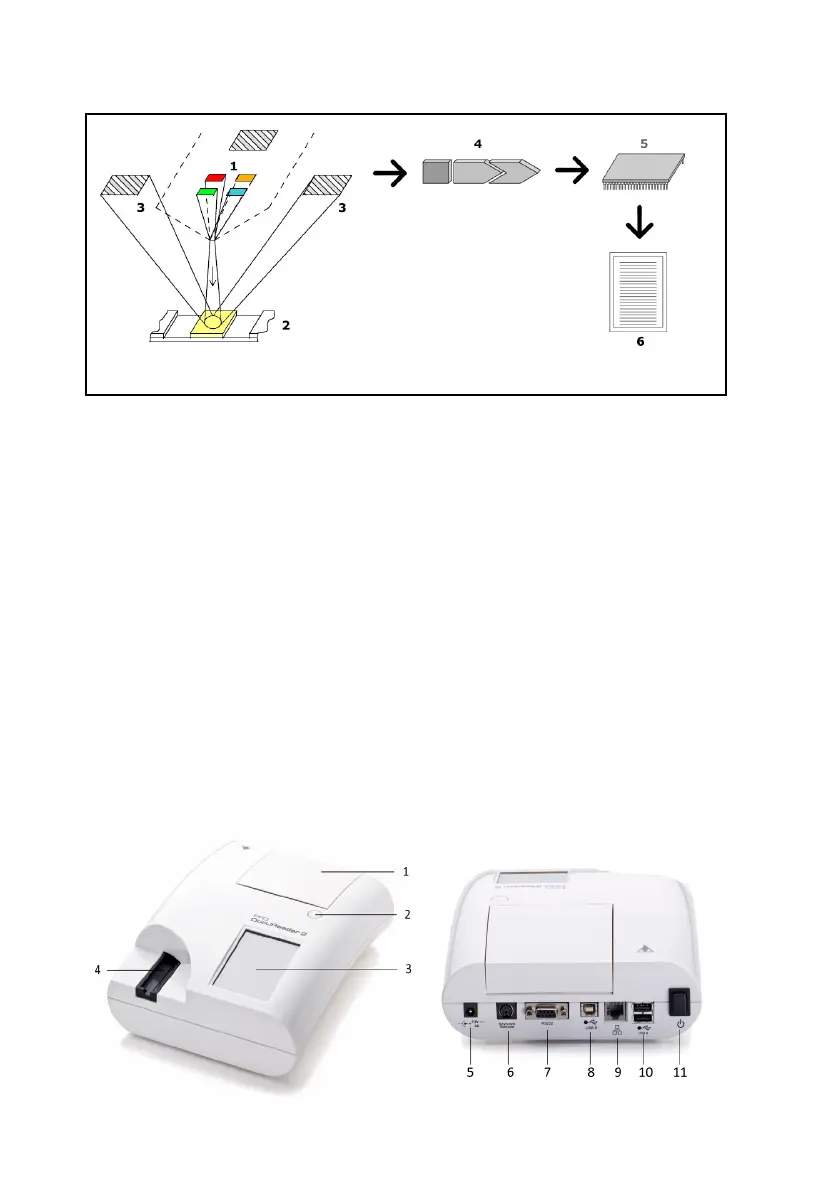
2.2 Components & functions
Fig. 2: Front and rear view of the analyzer, marked up
 Loading...