Running a Sample 4-11
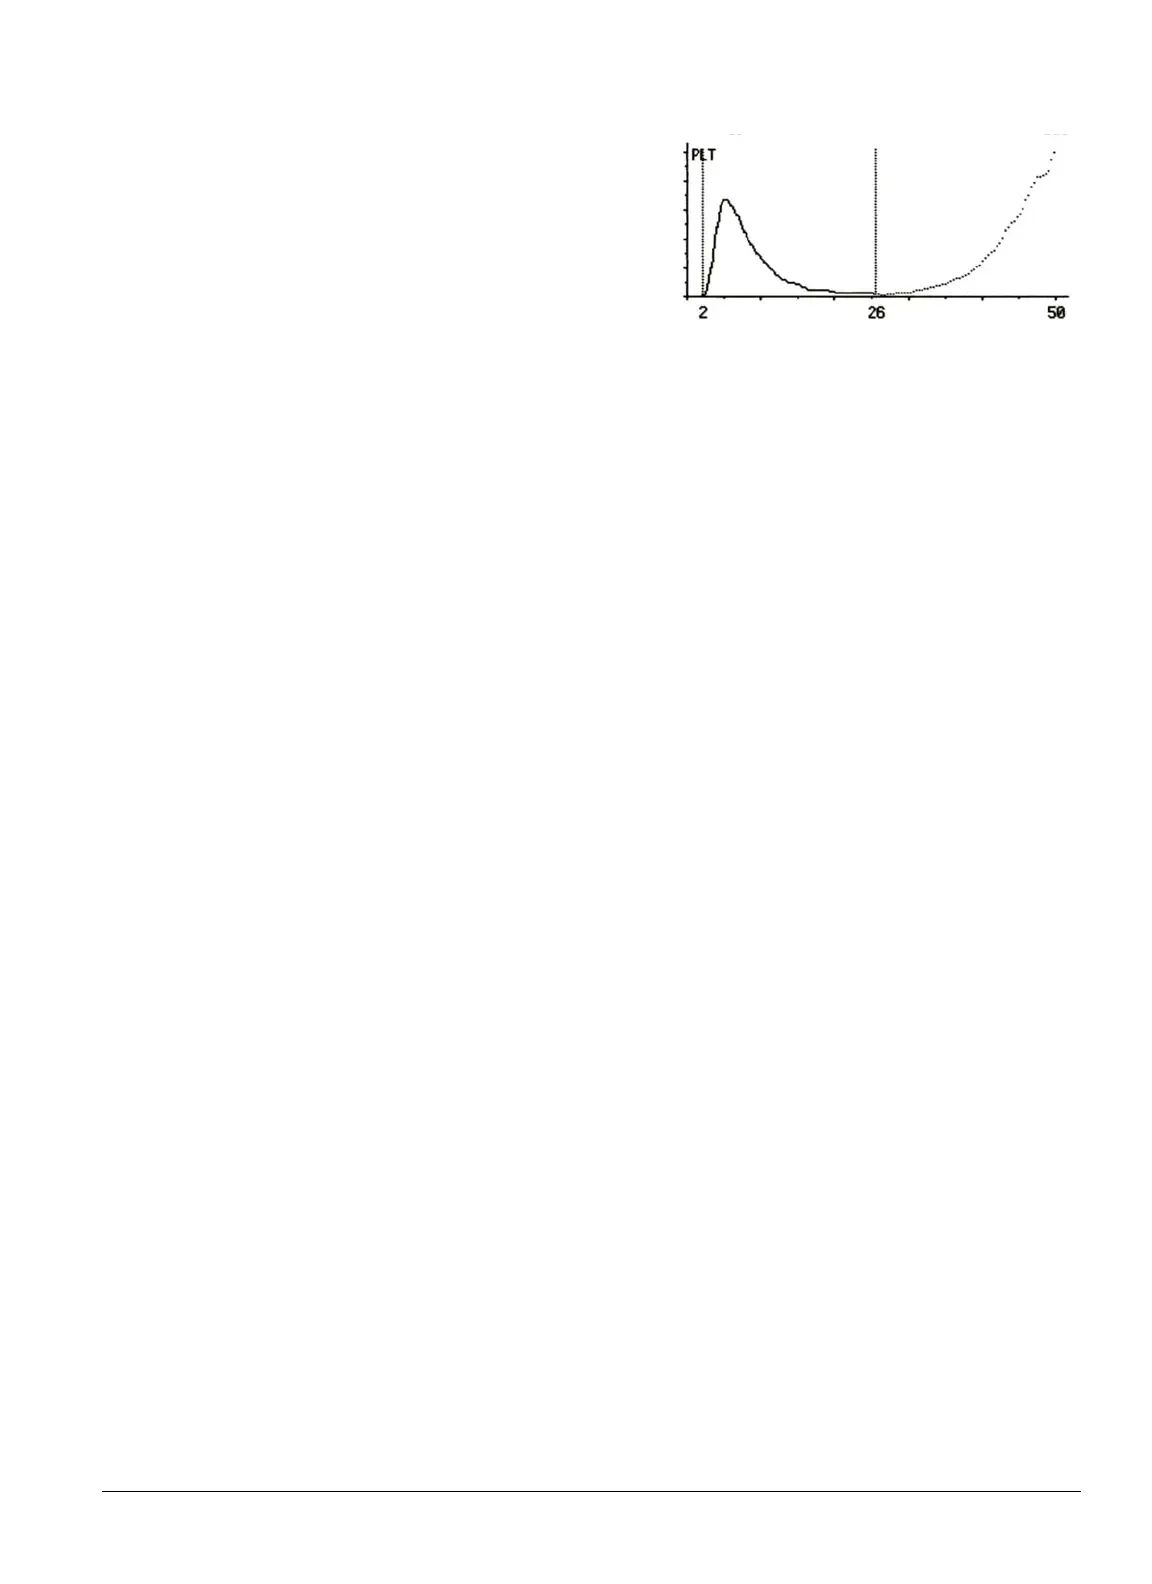
4.7.1.4 Platelet Histogram (PLT)
The PLT histogram is a magnified portion of the begin-
ning of the RBC histogram.
The example PLT histogram at right follows a log-normal
distribution, with a good separation from RBCs.
The most commonly identified anomaly in platelet histo-
grams results from aggregated (clumped) platelets. This appears as a flattened, lumpy histogram that
increases towards the right side (see
“Cat: Clumped PLT, Increased LYM” on page D-10
).