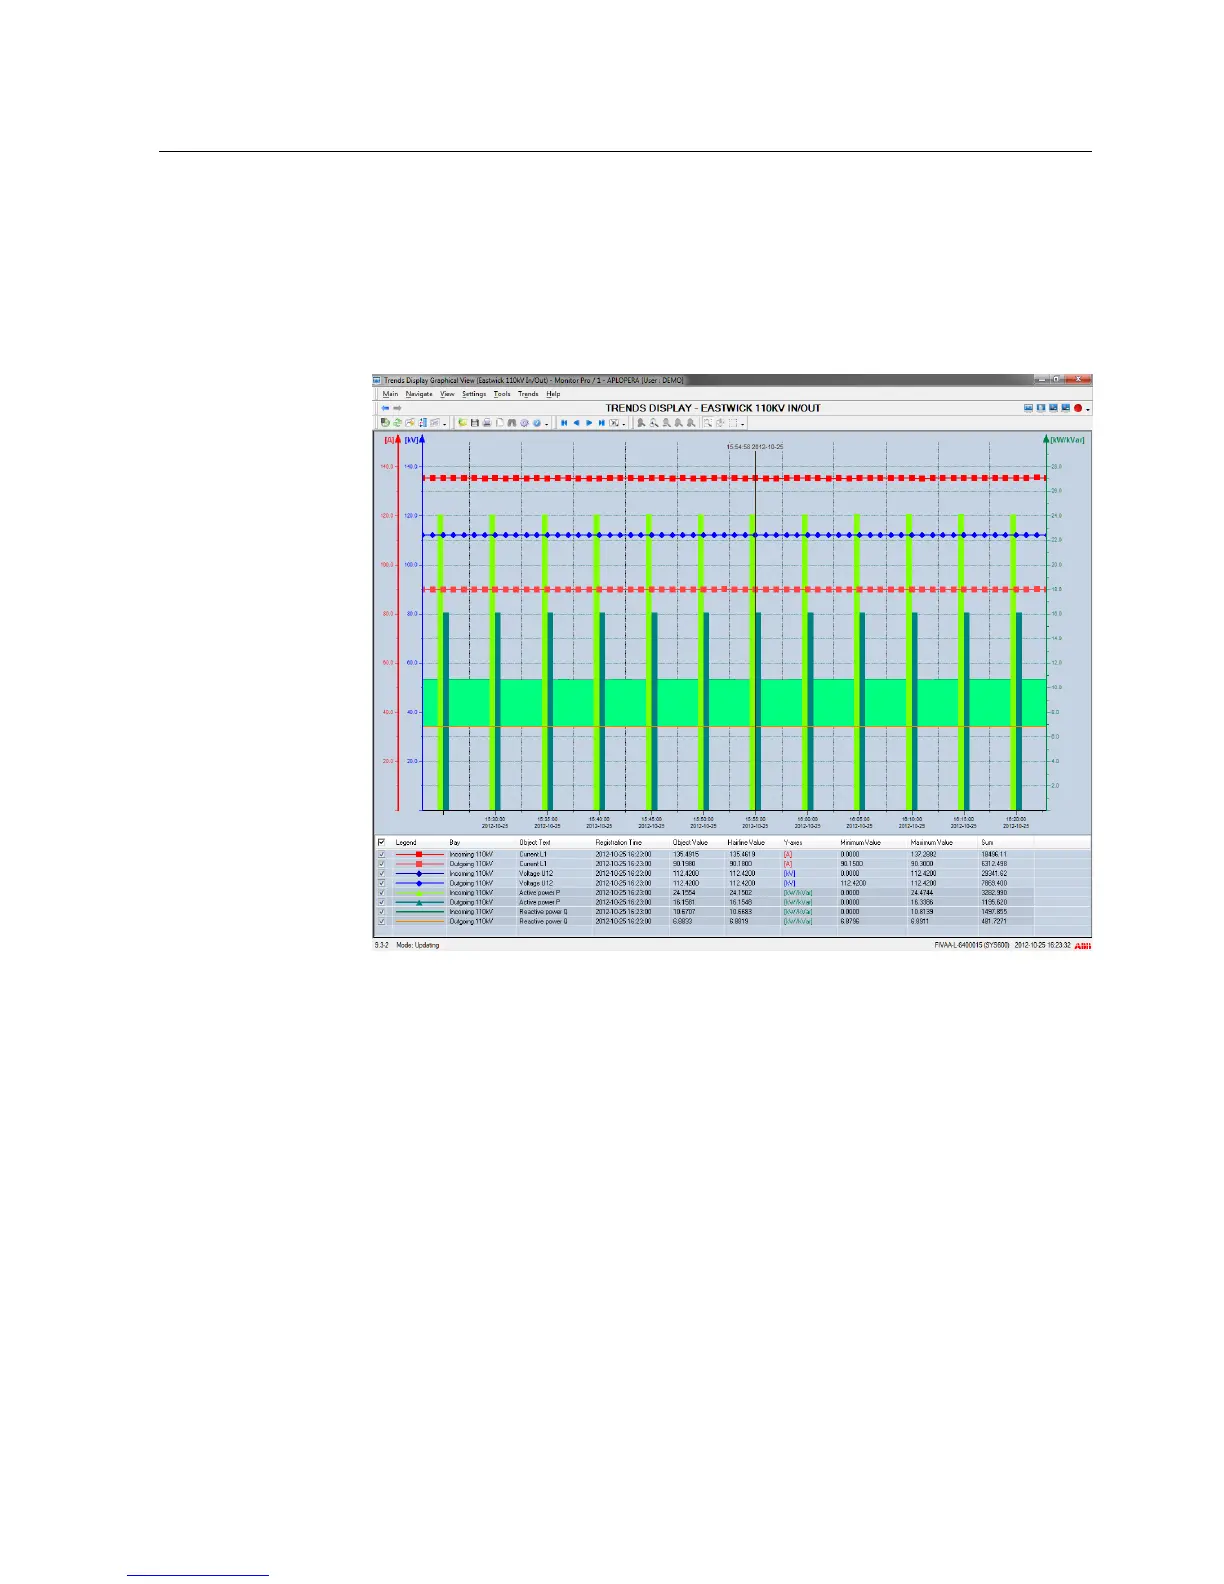
3.2.6 Trends Display
The Trends Display is used for trend analyses and for showing measured values in the
form of a curve or a table.
A trend is a time-related follow-up of process data. All types of process objects, for
example in and out data, binary, analog and digital data can be illustrated as trends.
Figure 3.7: The Trends Display
The Trends Display contains the following features:
• Graphical or tabular view
• Zooming mode
• Scrolling with scroll bars and panning
• Configurable axes and line properties
• Using legend
• Using hairline
• Update interval options from 10 seconds to 10 minutes
• Calculation formulas; direct, mean, sum, integral and difference
• Clearing trend data by the user
• Save, Open and Delete preconfigurations
• Printout option
• Update/Frozen modes
15
SYS 600C 2.93
MicroSCADA Pro
Product Guide
1MRS757729
16.11.2012Issued:
A/16.11.2012Version: