MyChron4 660
User Manual
Release 1.03
www.aim-sportline.com
70
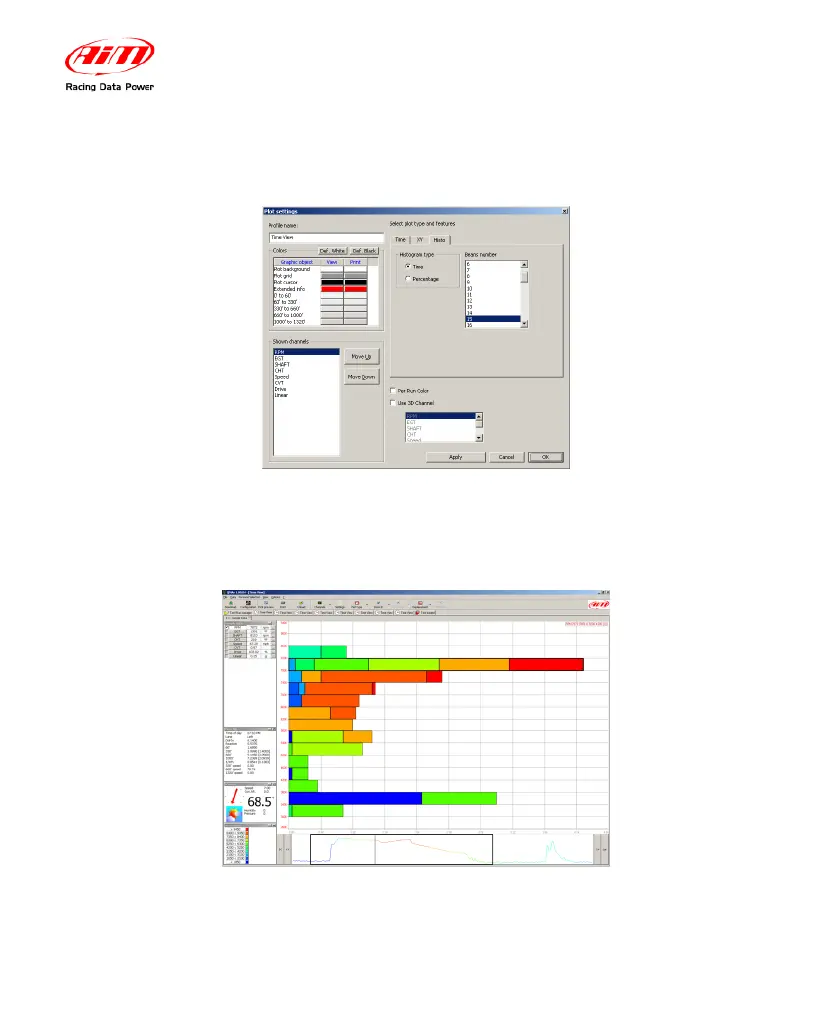
The next screenshot shows you that the parameters that can be set for this plot
are the histogram computation base (time or percentage) and the beans number.
Even the histogram plot can show a 3D channel. In this case, within a single
horizontal bar you can see multiple sub bars with different colours, the amplitude
of each sub bar lets you understand a distributed histogram of the 3D channel.