MyChron4 660
User Manual
Release 1.03
www.aim-sportline.com
69
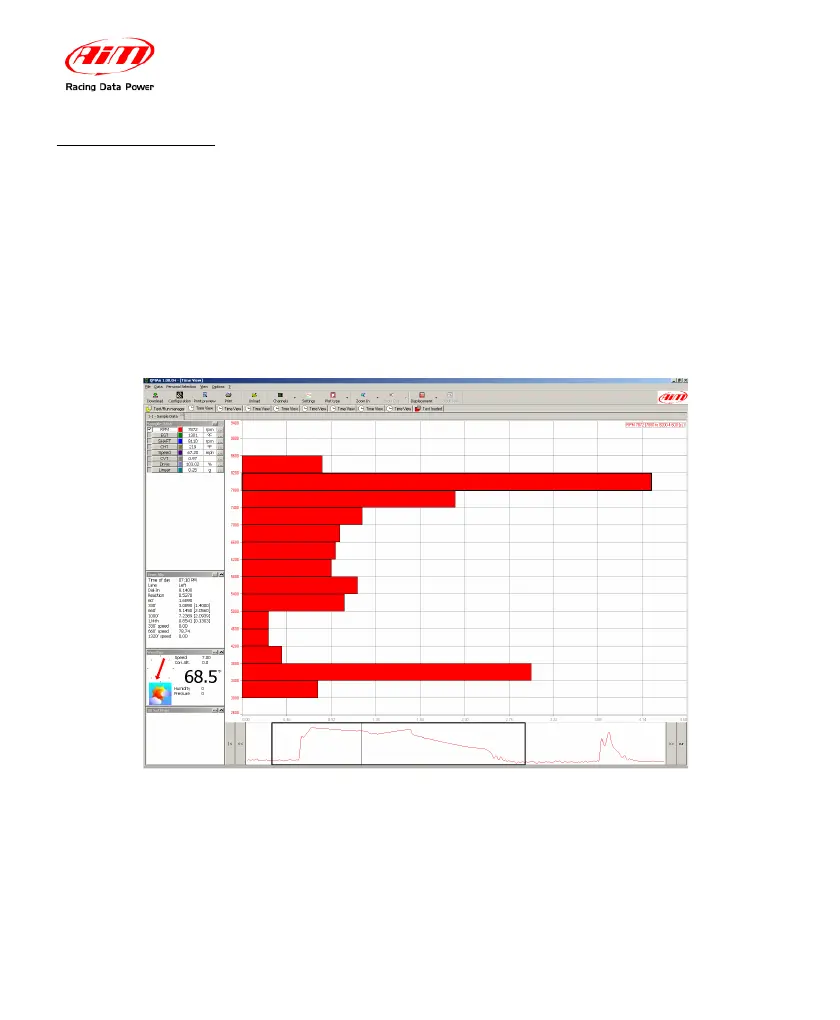
4.3.4 – Histogram
While showing a histogram plot you’ll be able to see how long a channel remains
within a certain band. In the following screenshot the RPM histogram lets you
visualize which RPM ranges are used the most in the run, providing you with
more information for tuning your engine.
Kindly notice that, while moving the mouse cursor over a bar on the plot, a tag will
show you the value of the bar.