MyChron4 660
User Manual
Release 1.03
www.aim-sportline.com
71
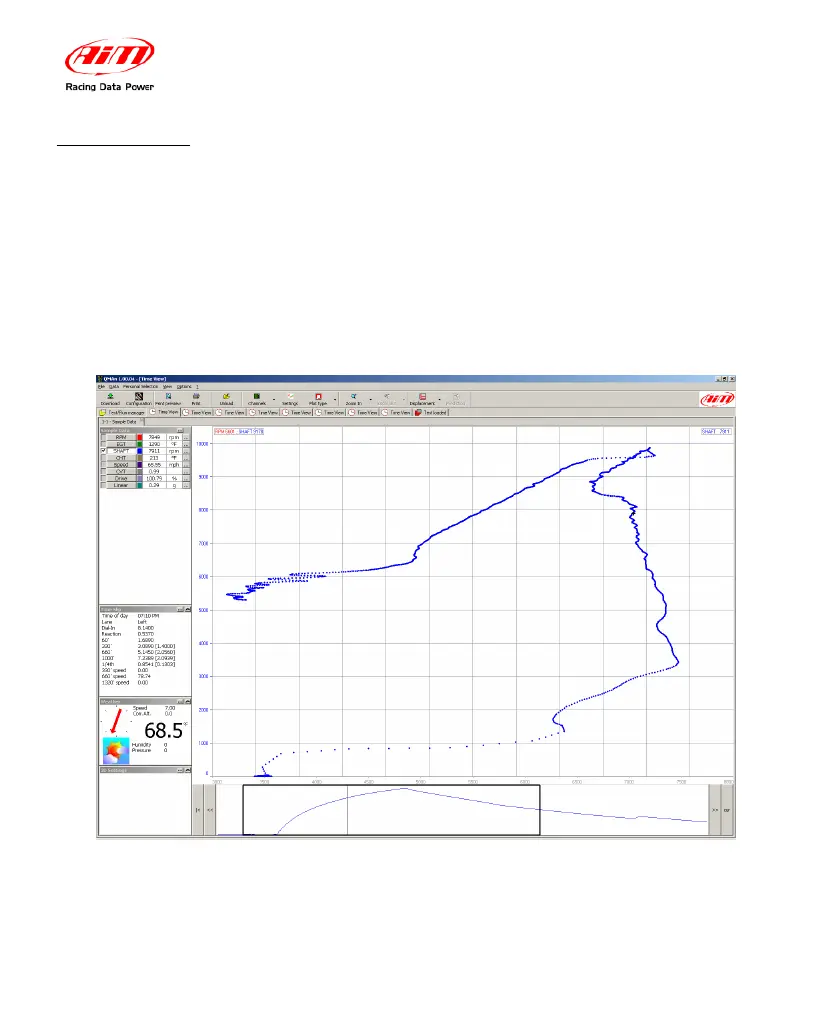
4.3.5 – XY Plot
The XY plot or scatter plot shows the traces of the enabled channels versus one
selected X channel. If you check the Cursor button in the run history bar you can
move the cursor within the run history bar and see what happens inside the XY
plot. In this “cursor movement” mode the drag and drop functionality of the time
window does not work. Simply unckeck the cursor button and the drag and drop
mode will be back.