26 AS-D+—AS-P Series Instruction Manual
AirSep Corporation
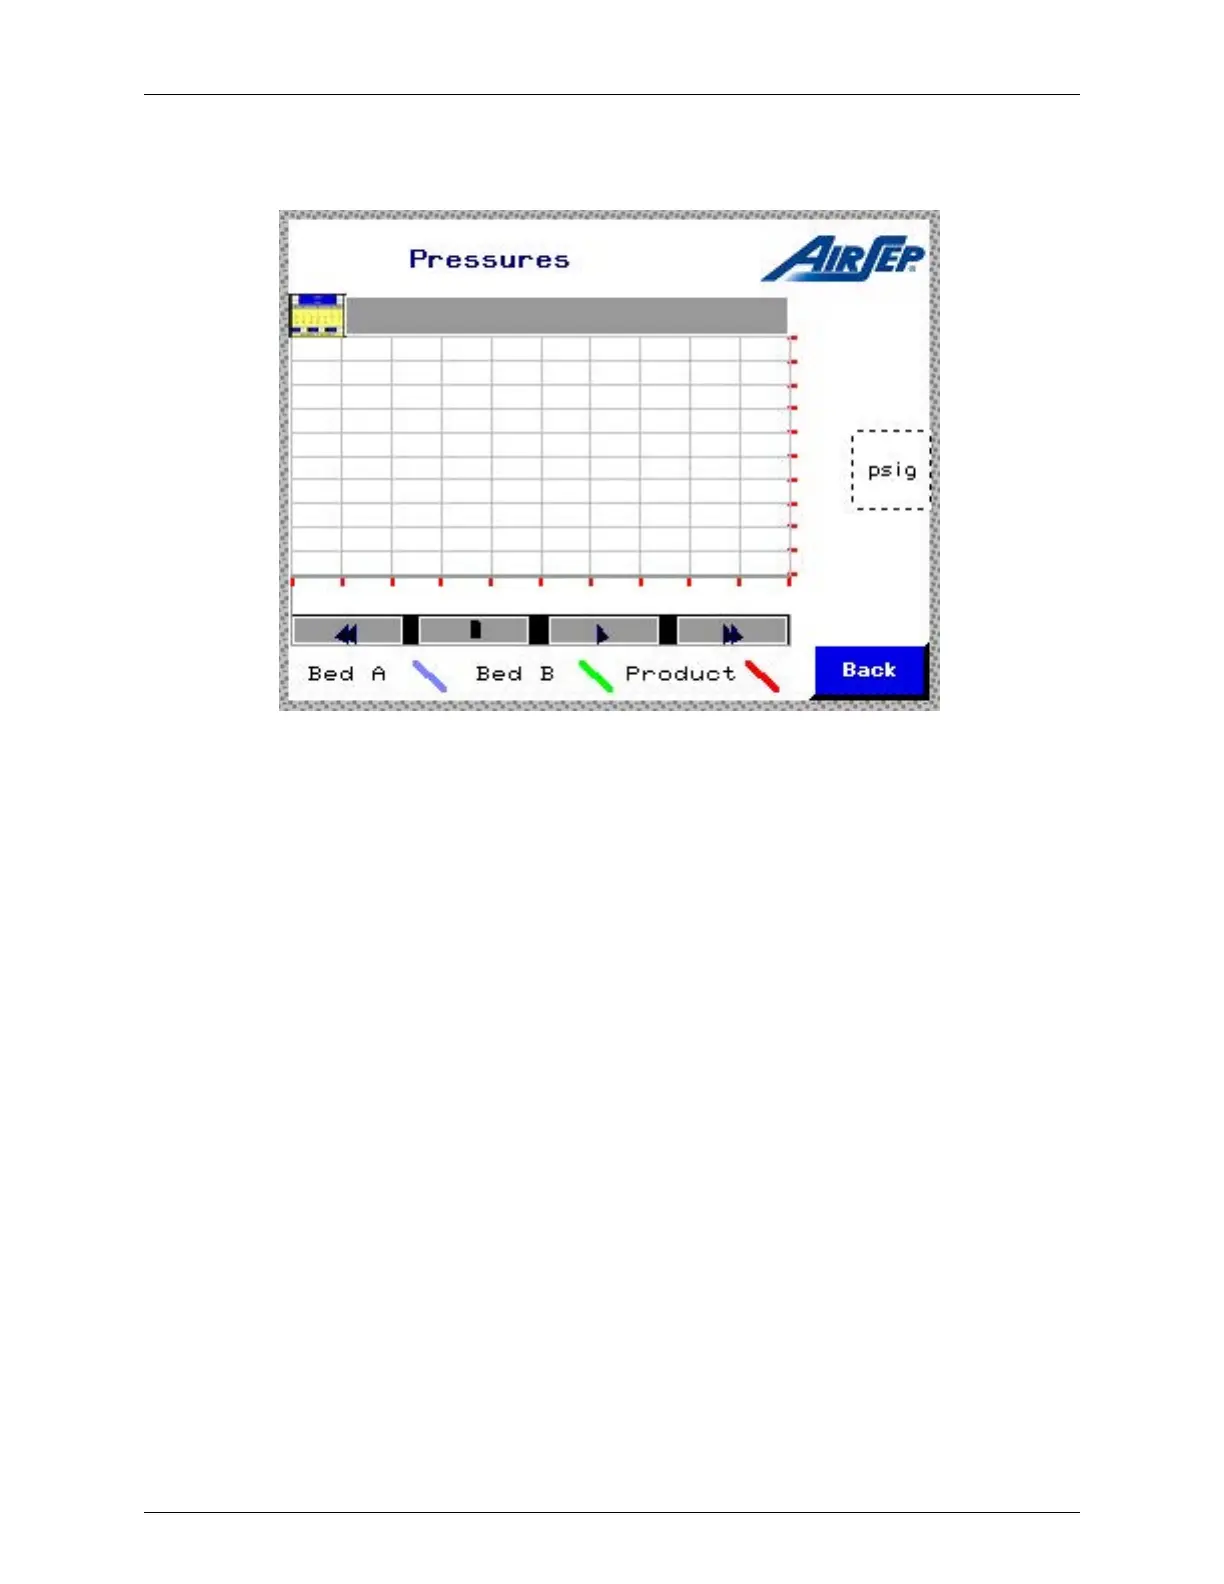
The ‘Bed Pressure Graphs’ icon takes to the Bed Pressure Graphs Screen as
shown.
Figure 4.7: Typical Bed Pressure Graphs Screen
The ‘Output Parameter Graphs’ icon takes to the screen that displays the graphs
between oxygen pressure vs. time and the oxygen concentration vs. time. The
‘Next Pen’ icon changes the scale of the ordinate to suit the respective displayed
pressure.
 Loading...