SPX+ Introduction Manual - updated until firmware 4997
- 20 -
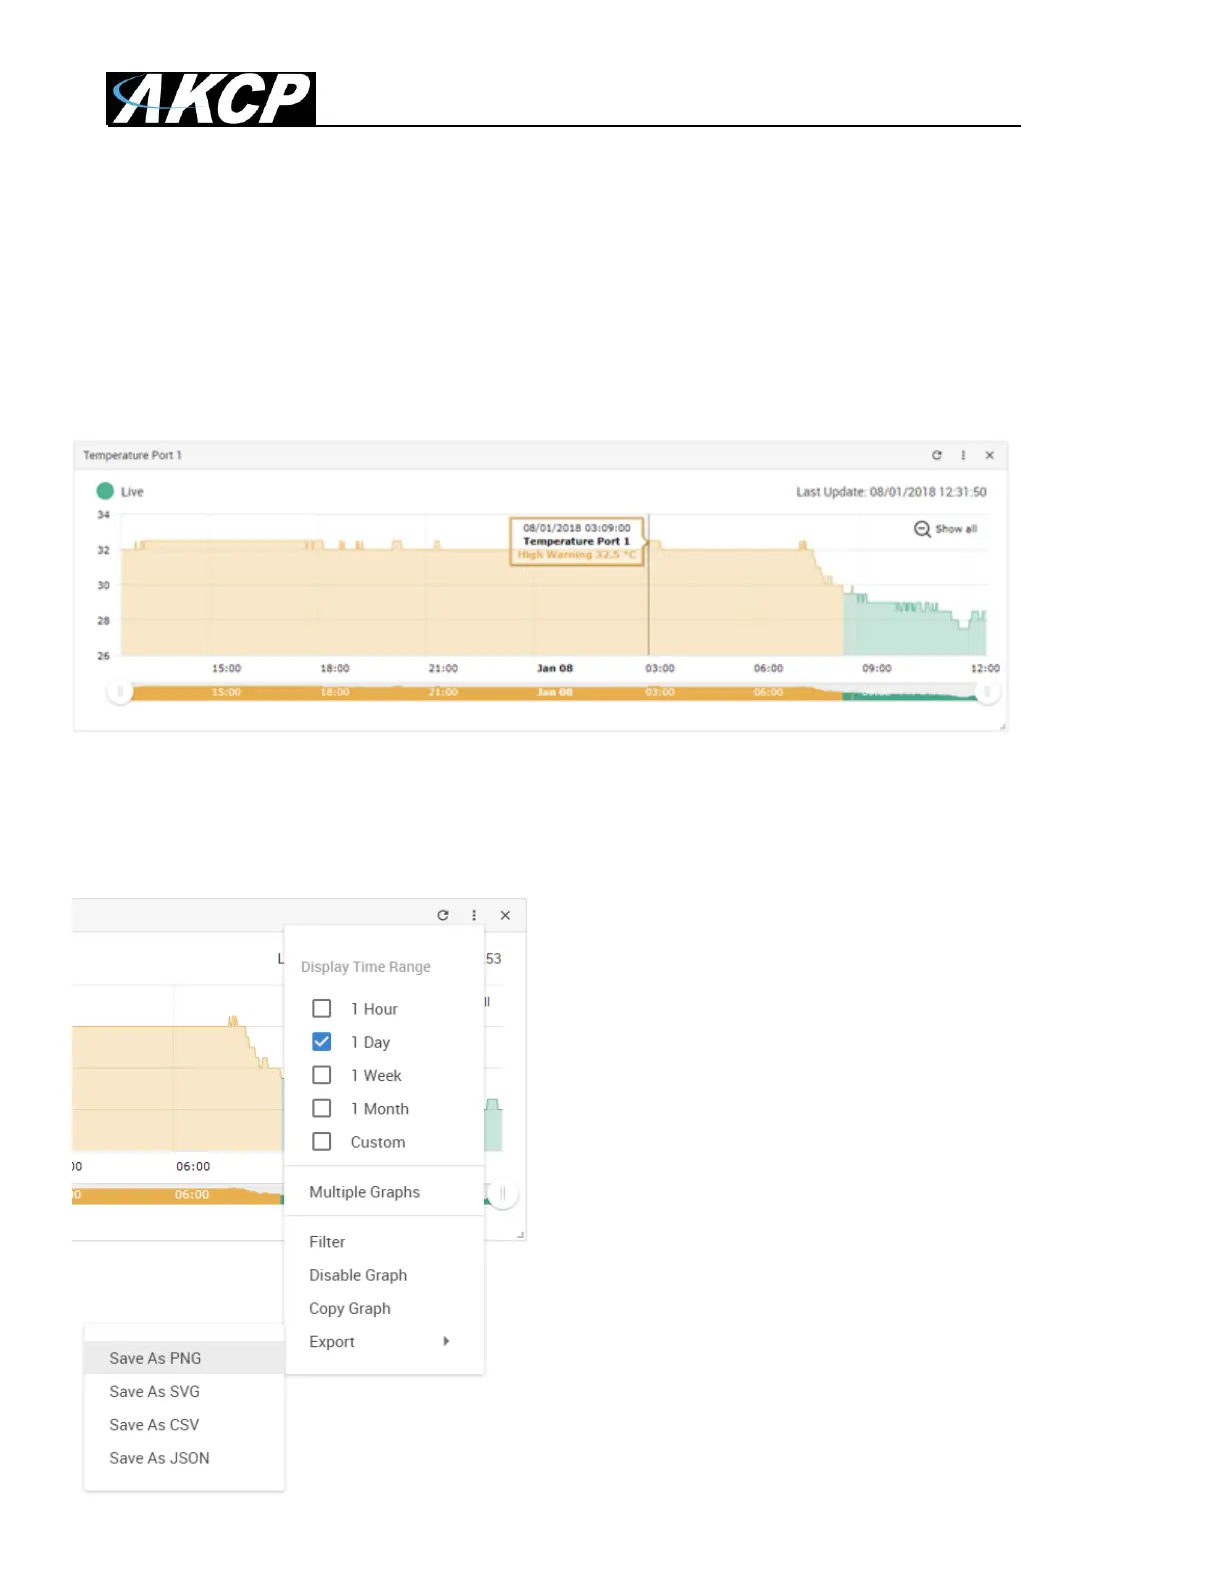
Graph feature
After you’ve enabled the data collection for a sensor, you can choose to display specific time intervals
of the stored data: hourly/daily/weekly/monthly and custom display interval.
You can also export the recorded data in multiple formats.
Important: The maximum number of enabled graphs per unit is 14.
In this example picture, we’ve chosen to display the temperature sensor’s daily maximum.
You could also resize the graph window (including full screen) and move the scale to display more or
less data.
You can choose to export the graph data in selected
formats by clicking on the graph’s menu on the right,
then by choosing the desired format from the popup
menu.
The file will be downloaded automatically and assigned
a file name that will contain the sensor’s name, IP
address of the unit, and the date and time.
 Loading...