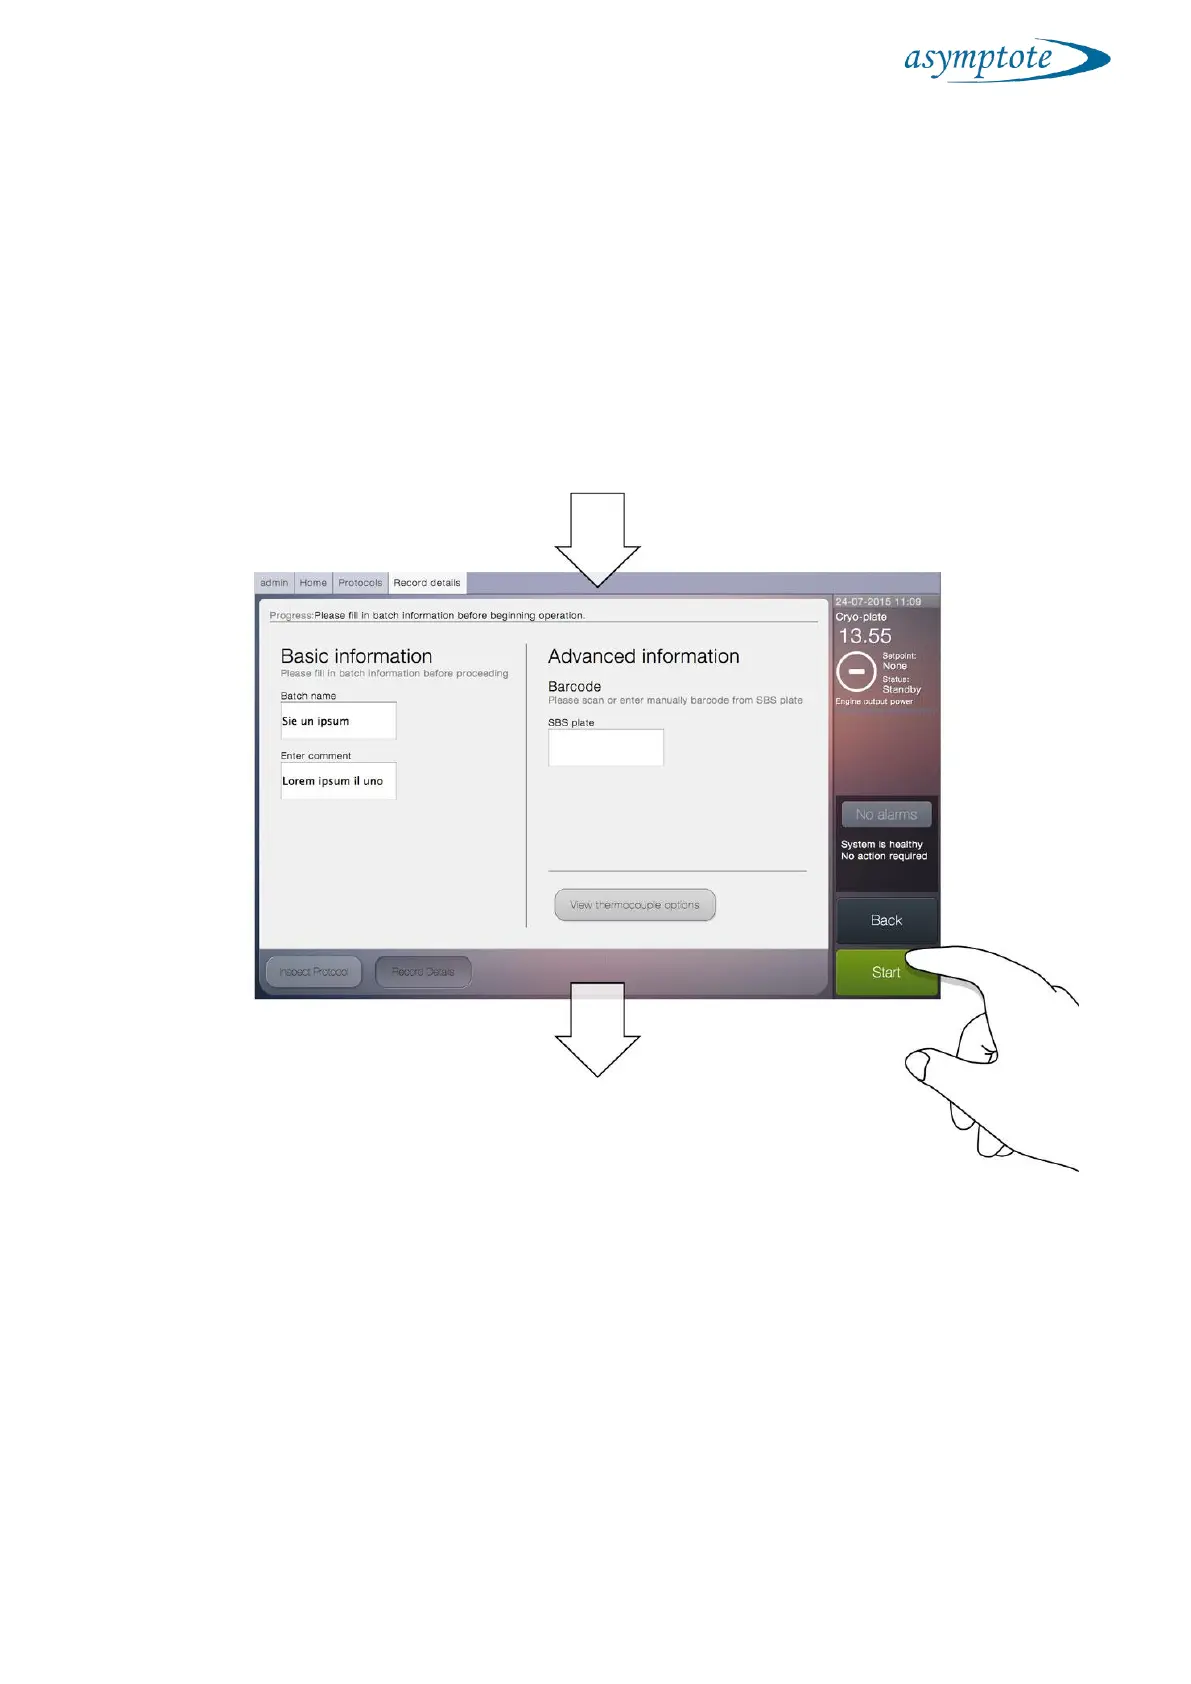
6.3.2 Record details
With a protocol selected, the main window shows the ‘Record details’ screen. This allows
the user to enter the following information:
Batch name: This is the name which this run is referenced by.
Enter comment: Any required details of the run.
The run can be started by pressing the ‘Start’ button.
6.3.3 Running
When a run has been started, the main window displays a live graph showing
temperature (vertical axis) against time (horizontal axis). There are two plots displayed
on the graph and these are referenced in the key at the top right:
‘Cryo-plate’ – blue line – this is the current recorded temperature of the plate.
‘Setpoint’ – yellow line – this is the current target temperature of the plate.
 Loading...