The Menus
bbe BenthoTorch Manual Page 71
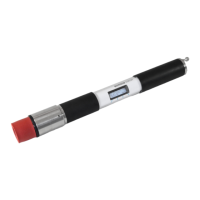
X-Axis: left side low values right side high values
Y-Axis: bottom low values top high values
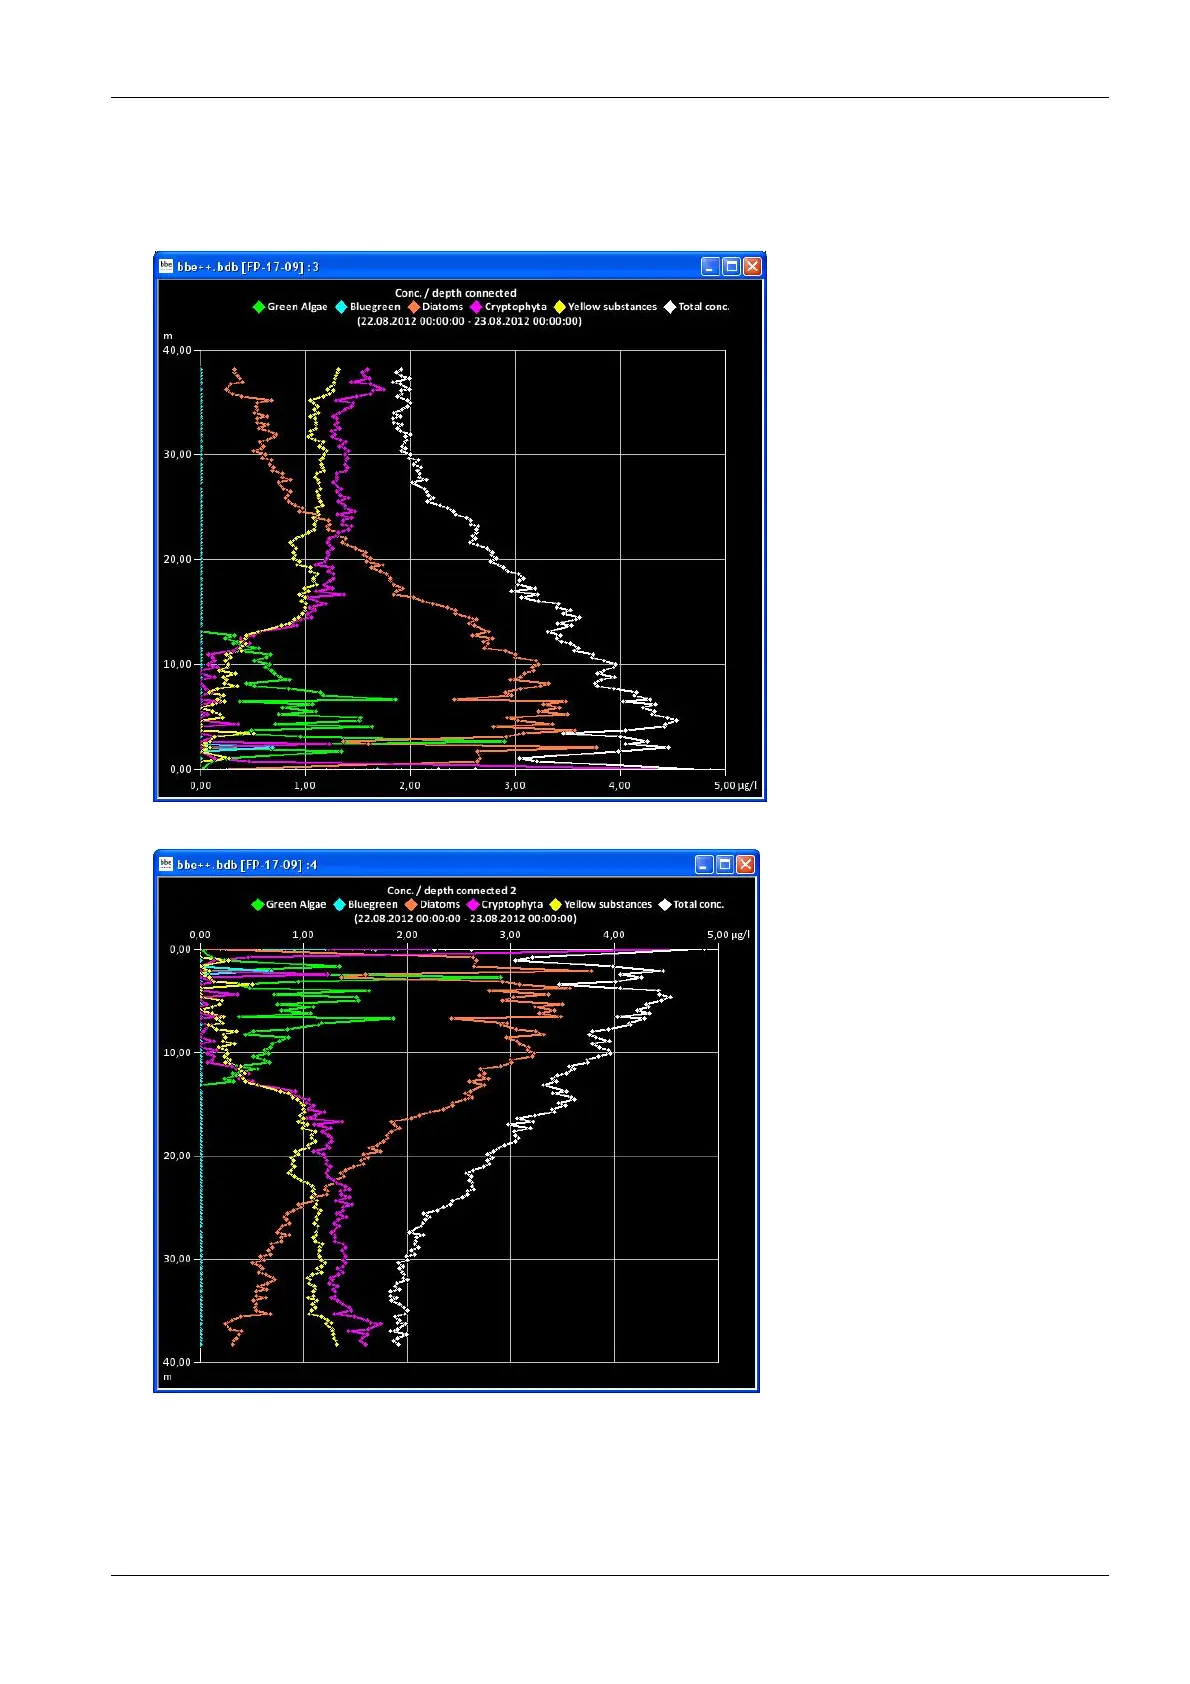
To display e.g. chlorophyll concentration versus depth, it is easier to use the top position of the X-axis and to
invert the direction of the Y-axis for the depth. Please see the following example: the first picture shows the
standard settings, the second one with a direction-inverted Y-axis and inverted position of the X-axis.
10. Click “OK” to confirm the settings.
11. Click “N
EXT
”.
12. Now the data and settings for the other axis can be selected.